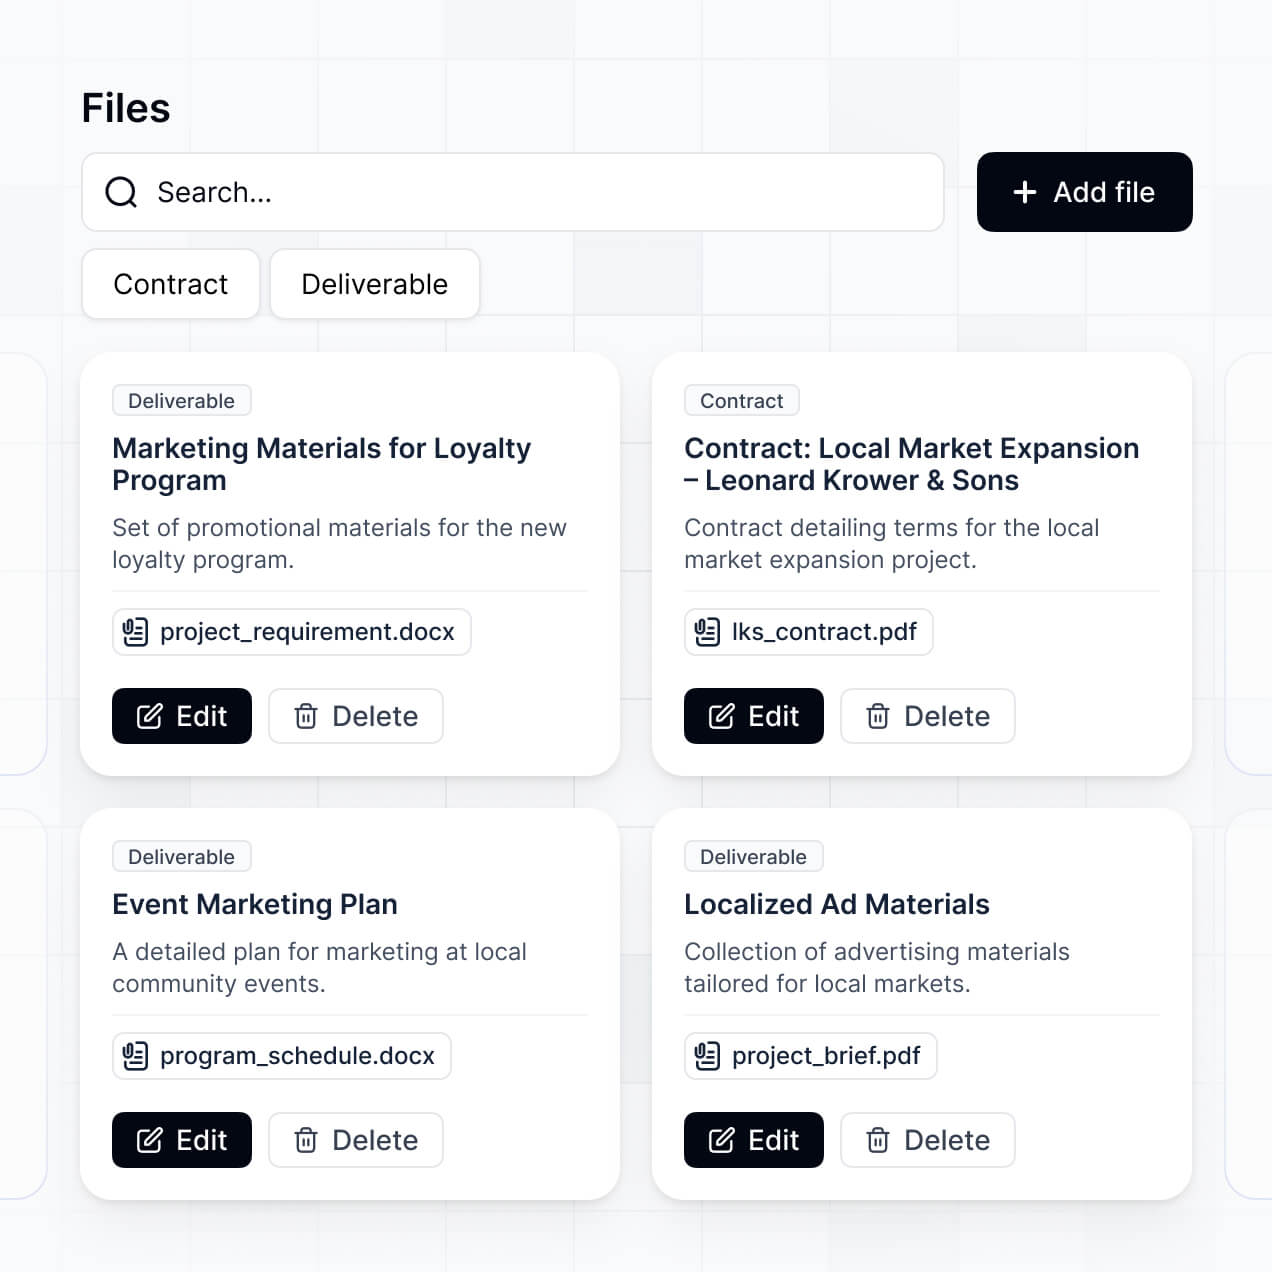
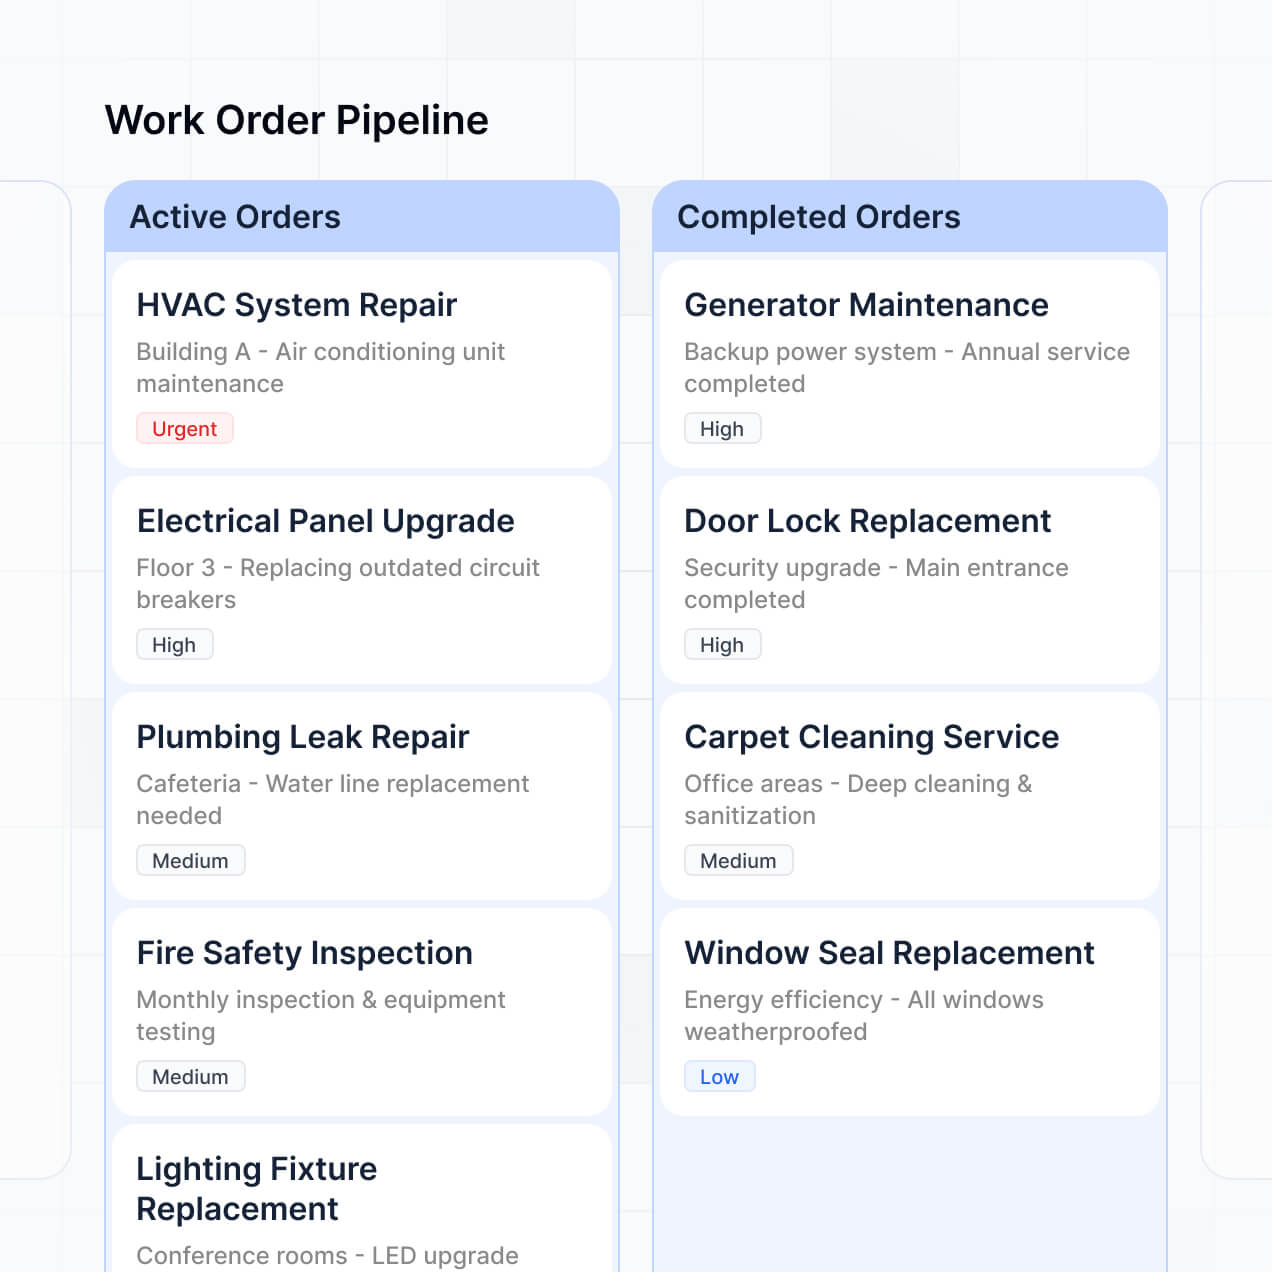
Track outcomes, visualize performance, and share progress in an AI-powered dashboard built with AI to fit your non-profit's workflow.
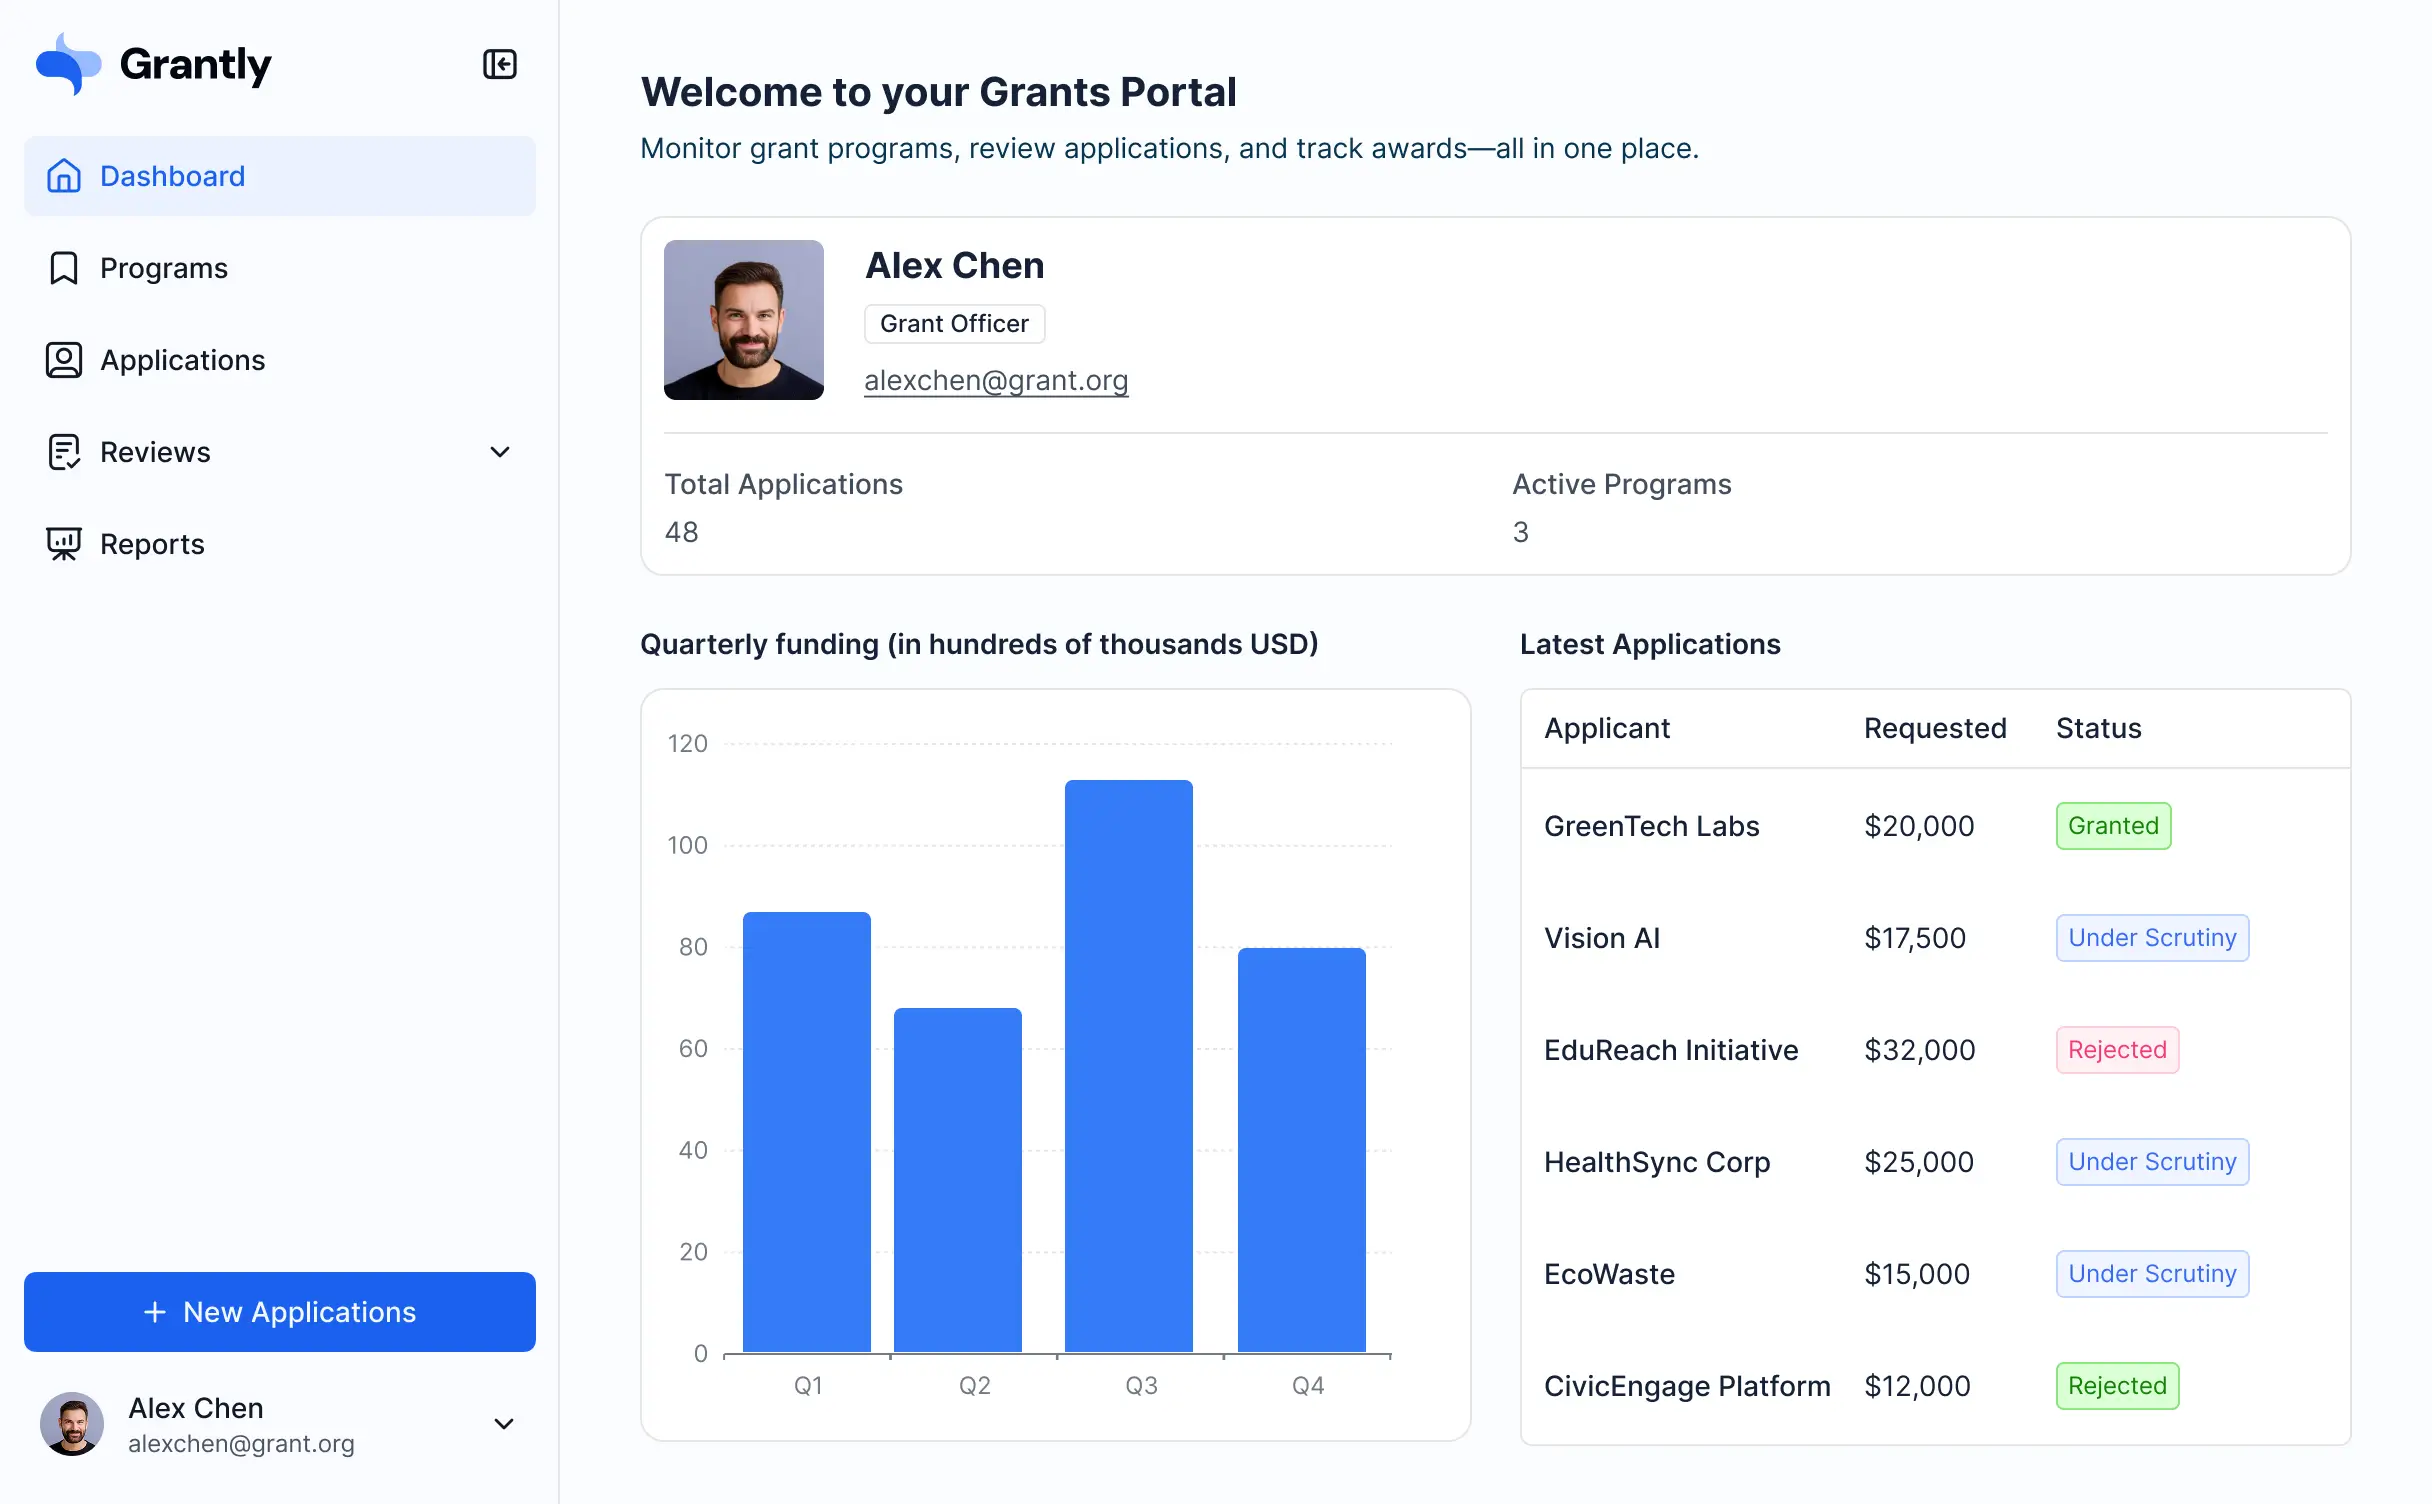

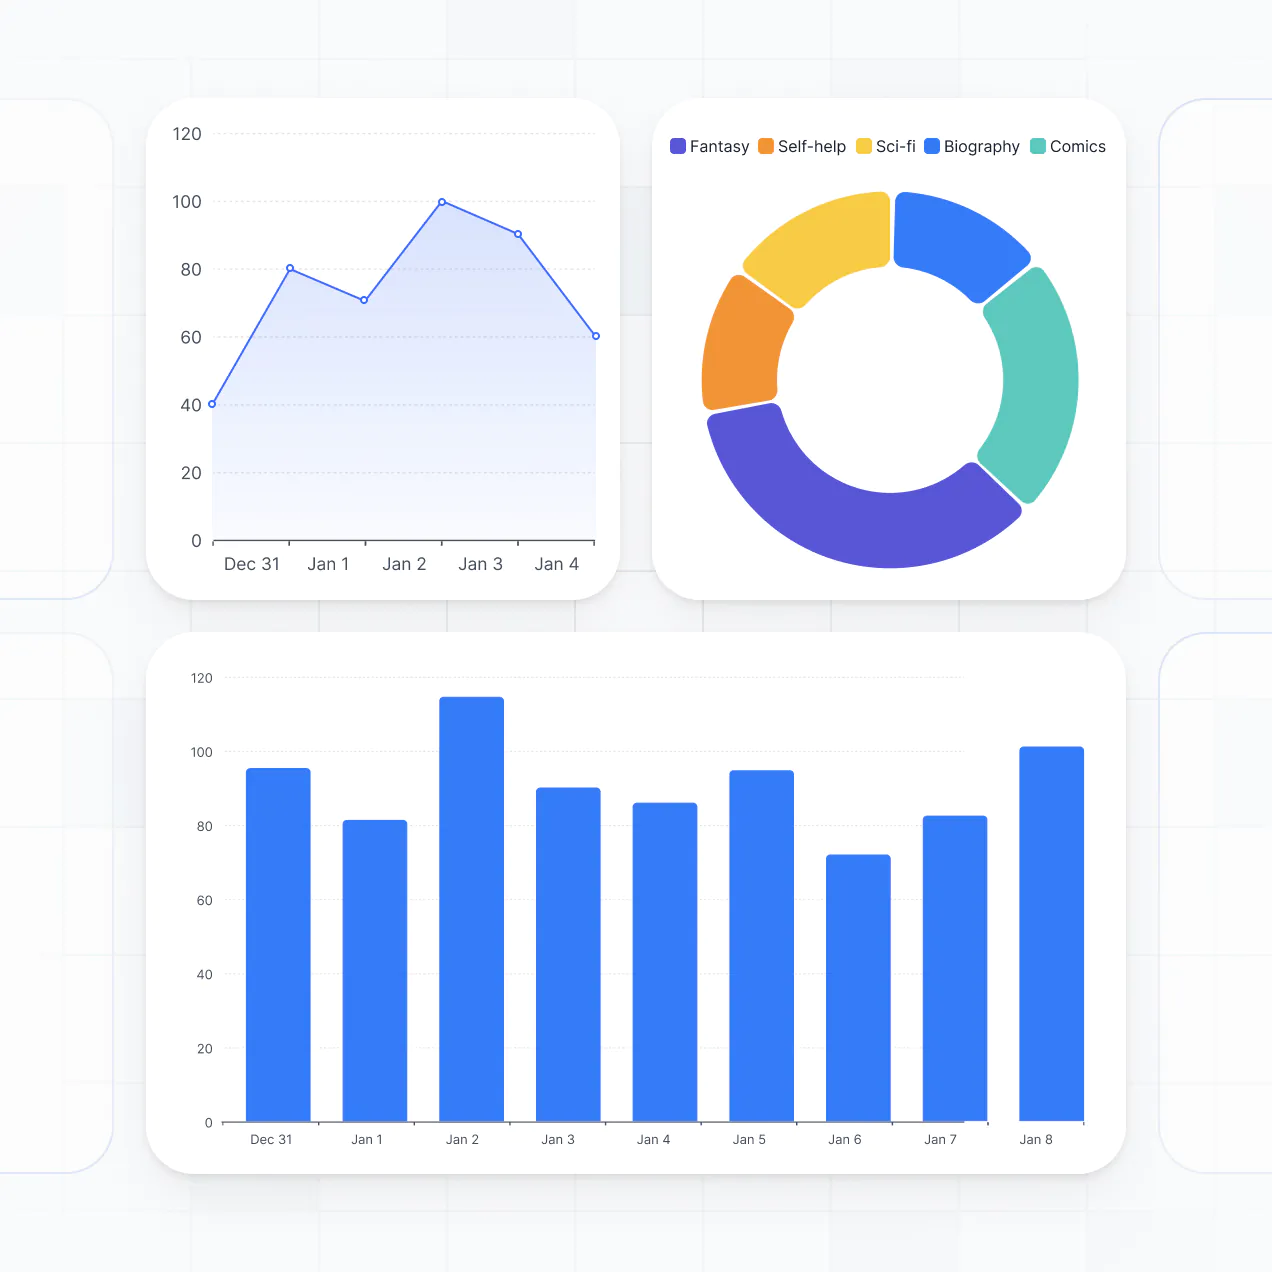
Customize an impact metrics dashboard that looks sleek out of the box. Add only the reporting blocks you need and iterate as your NGO's goals grow.


Connect field reports, donor CRMs, and grant spreadsheets with real-time sync—or manage everything in Softr Databases. Create one source of truth for your social impact.
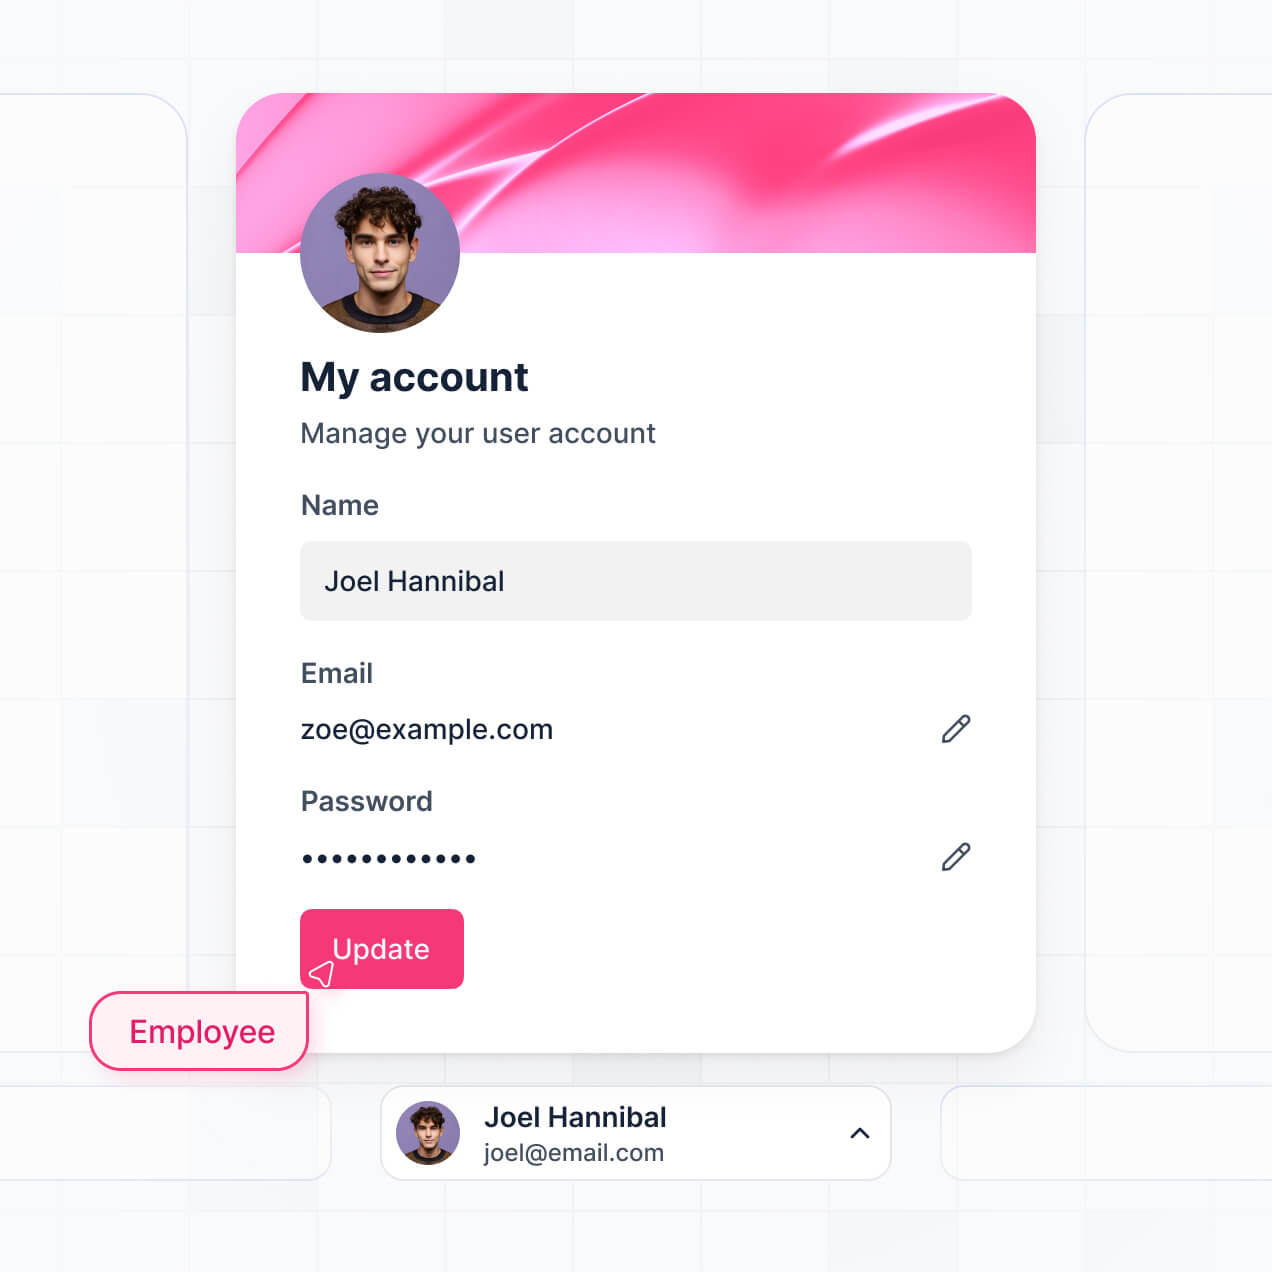
Give every staff member and volunteer the right data access. Set up secure logins, user groups, and granular permissions—no IT support needed.
Give program managers and field teams tailored dashboards, so each role sees just the impact data they are responsible for.
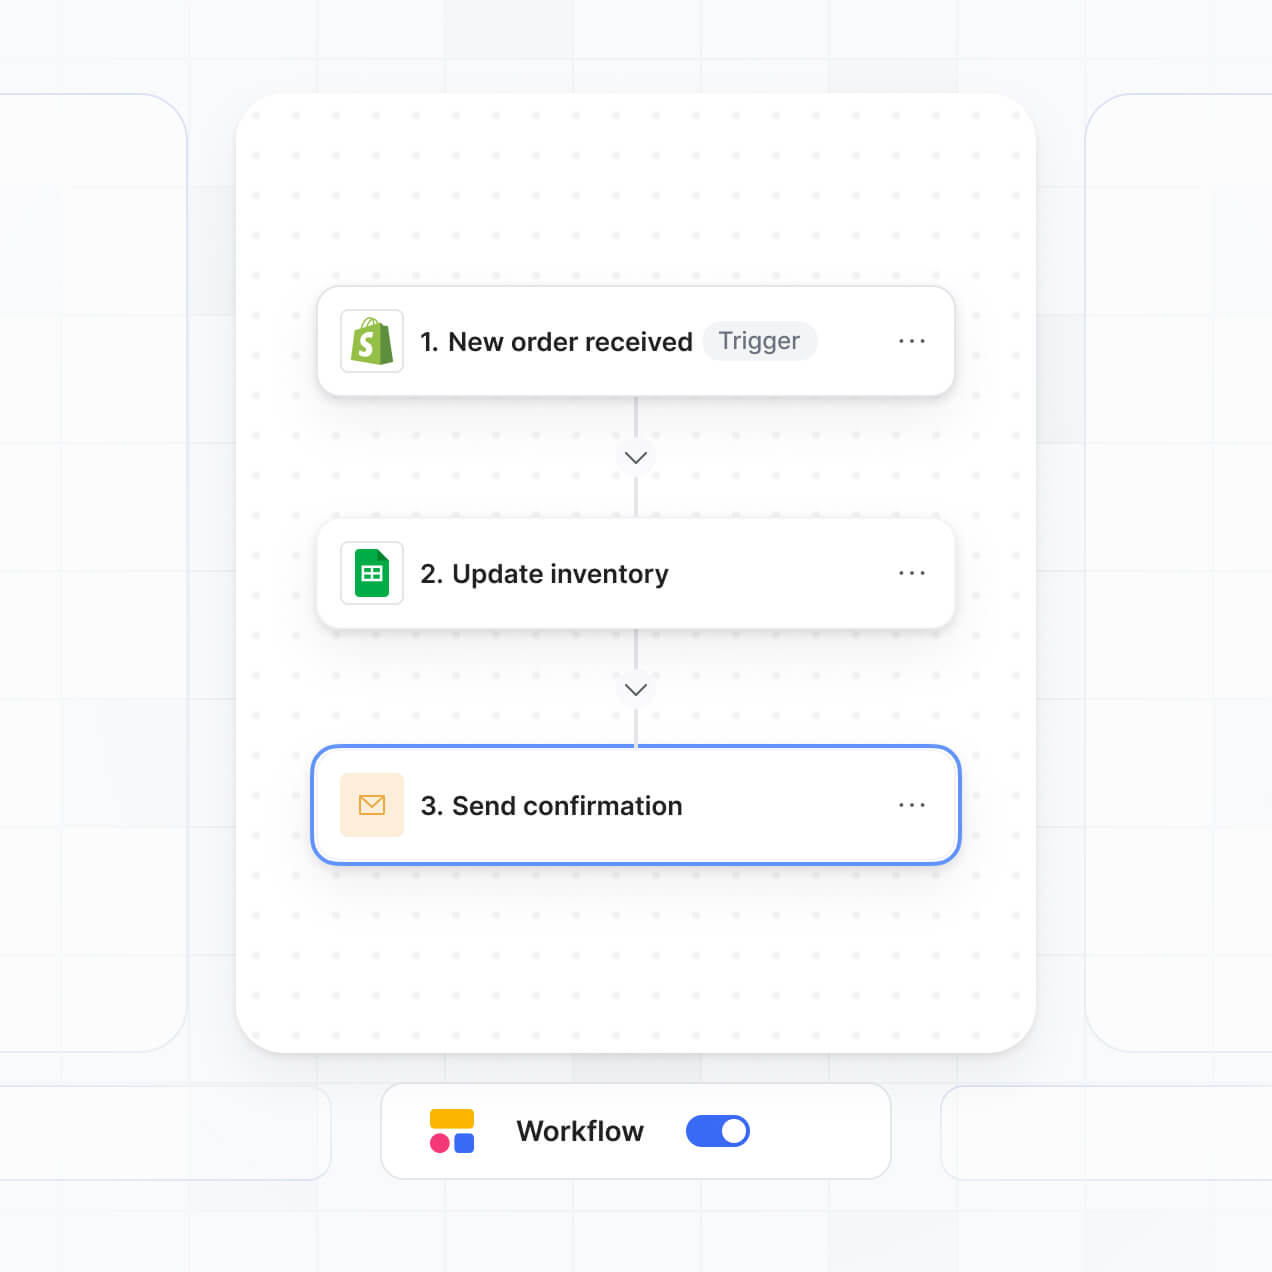
Streamline operations with Softr Workflows. Trigger native notifications or data updates when impact goals are met or new field data is submitted.
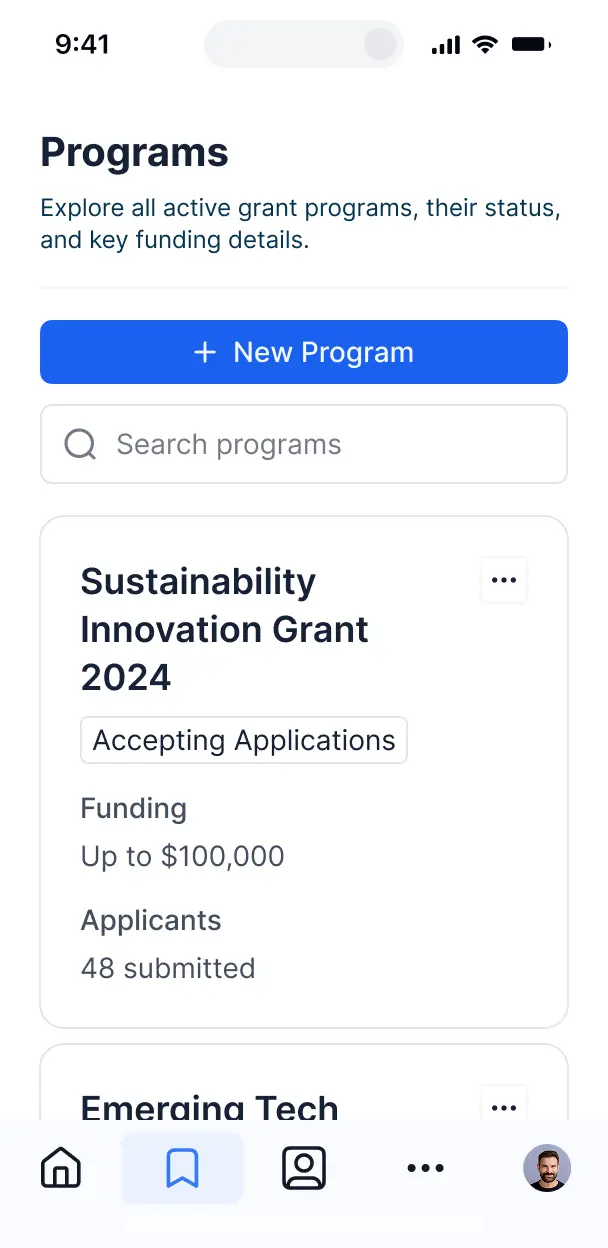
Access and update your impact metrics on the go. Your dashboard is mobile-ready out of the box for field workers and traveling staff.
Use Google or email logins to give your non-profit team fast, secure access to impact data—no internal IT tickets needed.
Keep program and donor data safe with SOC2 and GDPR compliance, plus fine-tuned access control at every levels of your NGO's reporting tool.
No more one-size-fits-all tools or costly custom builds. Softr is easy to use and fully customizable, so you can launch faster, adapt as you grow, and skip the complexity of traditional software.

Build your impact metrics dashboard in minutes with AI—no manual configuration or coding required.

Add features like automated donor reports or field data trackers as your non-profit's programs expand.

Start with a dashboard, then add partner portals, grant trackers, or forms—all in one place to save costs.
Co-build with AI
Simply describe what you need. Let Softr handle everything - Interface, database, workflows.
Iterate with AI or visually
Control most critical parts of your app yourself - roles, permissions, security.
Ship the same day
Invite team members or external clients and partners right away. No developer handover.
Use drag-and-drop blocks to build a portal that looks sleek and modern out of the box. Add only the features you need, and iterate as your workflows evolve.


An impact metrics dashboard is a centralized reporting hub where organizations can track, visualize, and share their social or environmental performance. It consolidates diverse data points—like carbon footprints, community outreach numbers, or funding distribution—into clear visual insights. By moving away from static spreadsheets and manual reporting, you create a real-time view of your mission's progress for stakeholders, donors, and team members.
Softr is the first AI-native platform for building business software, making it the ideal choice for creating an impact metrics dashboard that aligns with your specific KPIs. You can describe your reporting needs to the AI Co-Builder to instantly generate your metrics database, visualization pages, and filtering logic—all while ensuring your data remains secure.
You don't need to code to see the results. You can start by generating with AI, using a pre-built reporting template, or building from scratch. Everything runs on Softr Databases, or you can link data from tools you already use like Airtable, Google Sheets, or HubSpot. You have full control to customize charts, manage role-based visibility for donors versus internal staff, and brand the dashboard to match your organization's identity. It is fast to deploy and flexible enough to adapt as your impact goals evolve.
You can include a wide range of analytical features in your impact metrics dashboard tailored to your reporting workflow. A high-impact dashboard usually combines visual reporting blocks with AI-driven insights:
- AI-Powered Intelligence – Use Ask AI to let stakeholders query impact trends conversationally, or set up Database AI Agents to automatically categorize field reports or summarize qualitative impact stories.
- Vibe Coding Blocks – Create custom UI components—like a dynamic geography-based heat map—using the AI Code block to 'vibe code' the exact visualization your mission requires.
- Softr Workflows – Build native automations, such as an automated alert that triggers when a specific impact milestone is reached or a monthly PDF report summary sent to board members.
- User Portals & Logins – Securely manage access so different program managers only see the performance data for their specific regions or initiatives.
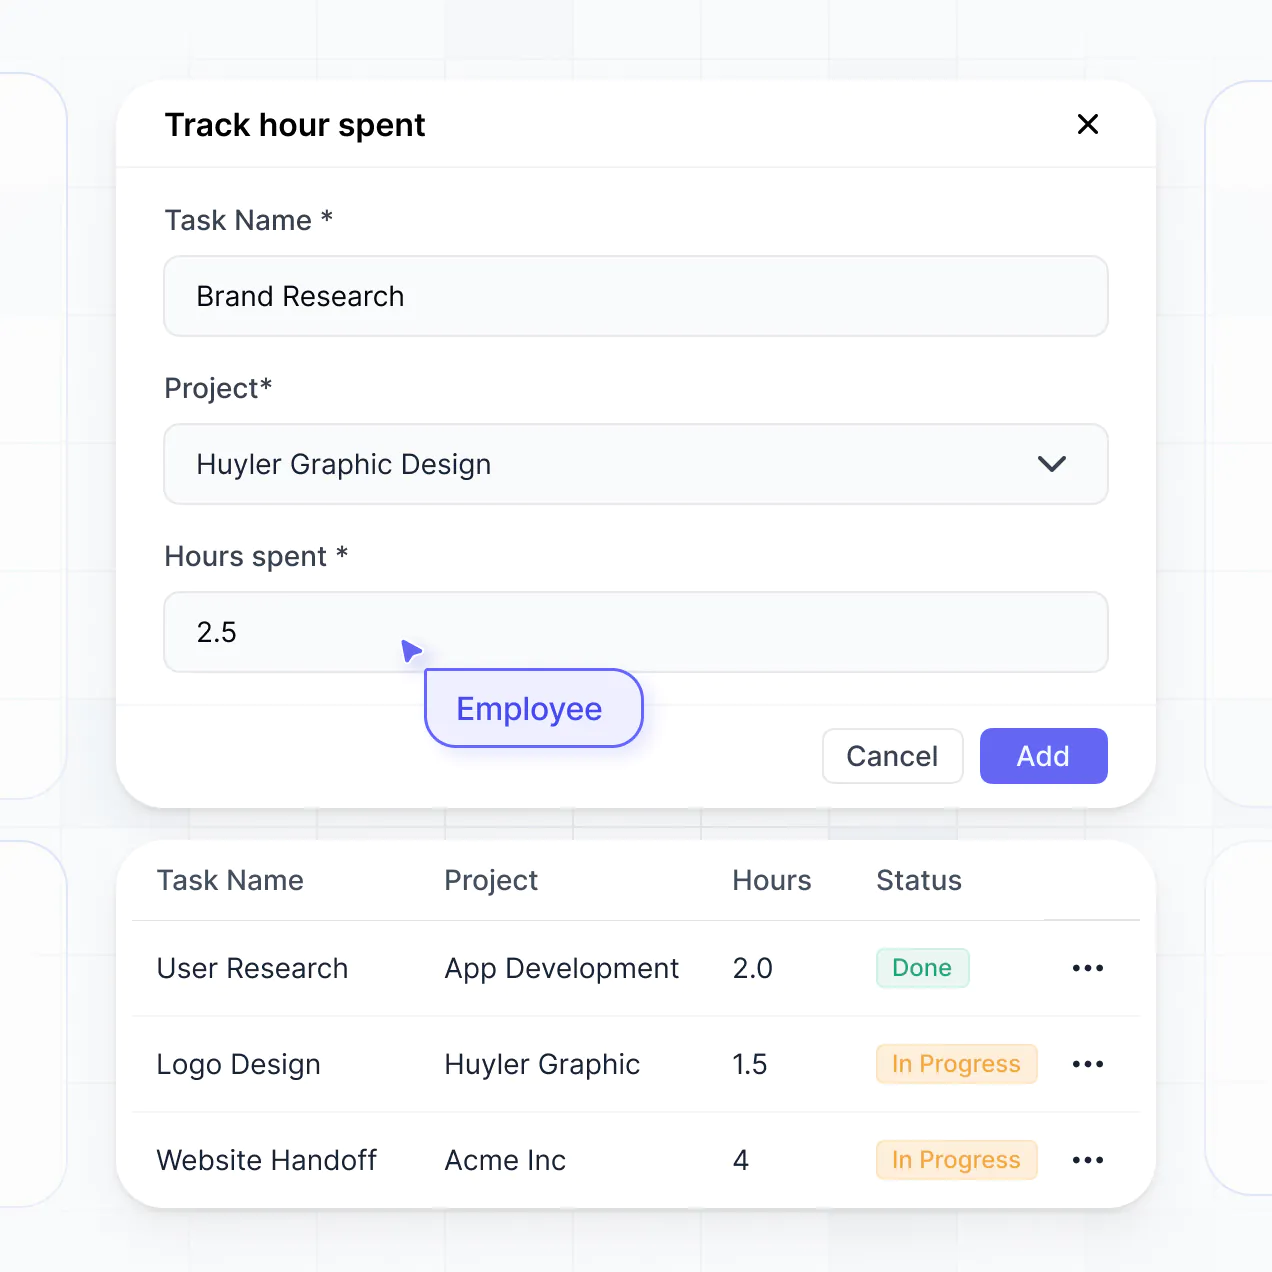
- Forms & Data Collection – Gather field data directly through custom forms with file uploads for photos of completed projects.
- Dashboards & Charts – Visualize long-term trends and ESG metrics with real-time bar graphs, pie charts, and progress bars.
- Lists & Advanced Filtering – Manage granular data with searchable tables and detailed views of individual programs or grants.
All these are built using Softr's drag-and-drop system, and you can always use the Vibe Coding block to generate a highly specific calculation or visual component with AI.
Vibe coding is about prioritizing your goals and using AI to build the perfect reporting tool instantly. You can 'vibe code' an impact metrics dashboard in Softr by describing your intended KPIs and data sources to the AI Co-Builder. Softr then produces a professional dashboard on a secure architecture.
While other tools might generate messy, unmanageable code, Softr handles the heavy lifting—like data security, multi-user permissions, and dashboard logic—natively. This allows you to focus on the 'vibe' of your storytelling and data visualization without worrying about the underlying technical maintenance. You define the impact goals, and Softr builds the functional evidence for your team and stakeholders.
Yes. You can manage multiple regional teams or separate impact projects within a single dashboard. Each user only sees the specific metrics and programs assigned to them based on their login and role. This is particularly effective for global non-profits or investment firms monitoring a diverse portfolio of social enterprises, ensuring data privacy across different impact sites.
Yes, you can. You don't need a pre-existing database to begin measuring your results. If you are starting your tracking from scratch, you can use Softr Databases, which is integrated directly into the platform to store your program data and performance figures.
If you do have impact data residing in tools like Airtable, Google Sheets, or SmartSuite, you can connect those as well. You can even use the REST API to pull in external metrics. Regardless of where the data lives, you have complete control over how those metrics are calculated and displayed.
Softr Databases is the recommended native source for impact metrics dashboards. It offers high-performance tracking and instant automation triggers, ensuring your dashboard updates the second a new data point is logged.
Softr also connects to over 17 external data sources if your data is already hosted elsewhere. You can link to Google Sheets, BigQuery, HubSpot, and others. You can even combine sources—for example, pulling financial data from HubSpot and social impact figures from Softr Databases into one unified view. Most sources support real-time sync, so your dashboard always reflects the most current impact status.
Yes, Softr gives you granular control over how different stakeholders interact with your impact metrics. You can customize the layout and navigation to separate executive summaries from deep-dive technical reports. Pages can be restricted so that a field worker only sees their data entry forms, while a board member sees the high-level performance charts.
You can define roles like 'Program Manager,' 'Admin,' or 'Public Viewer' to control viewing and editing rights. This is vital for impact reporting, where you might want the public to see a summary dashboard while keeping sensitive financial or participant data private to internal staff. Customizing views ensures every stakeholder gets the exact insights they need without compromising security.
Yes, you can completely white-label your impact metrics dashboard in Softr. Use your organization's logo, secondary brand colors, and custom fonts to ensure the reporting tool looks like an official part of your digital infrastructure. You can host it on your own custom domain and remove all Softr branding, providing a professional and seamless experience for your partners and donors.
Yes, you can. Softr provides the flexibility to control the visual flow and structural design of your dashboard. You can modify colors, fonts, and spacing to highlight specific success stories. You have a variety of layout blocks available to showcase your data effectively:
- Table blocks – for listing detailed grants, expense records, or project timelines.
- Card blocks – to highlight individual success stories or key team members.
- Detail View – for deep dives into specific regional impact reports.
- Forms – for field staff to submit monthly data.
- Charts – to visualize progress toward carbon neutrality or social goals.
- Calendar blocks – to keep track of reporting deadlines and audit dates.
If your reporting framework changes next quarter, the visual builder makes it easy to drag in new charts or update your metrics on the fly.
Security is built into the core of Softr. All impact data is encrypted in transit and at rest, hosted on reliable infrastructure. You maintain full control over data visibility through role-based permissions and visibility rules, ensuring only authorized users see sensitive information.
For dashboards using Softr Databases, data is stored in a secure SOC 2 Type II compliant environment in Germany. For those connecting external sources like SQL or Airtable, Softr acts as a secure display layer and doesn't store your external records. We strictly follow industry best practices for platform monitoring and access control to ensure your organization's data remains protected.
It is fully production-ready. While some AI tools produce experimental code that is difficult to scale, Softr builds your impact metrics dashboard on top of a stable, enterprise-grade architecture.
We provide the critical infrastructure like secure authentication and permissions out of the box. This bypasses the typical 'Day Two' struggle of managing generated code; instead, you get an immediate, secure, and scalable reporting system that your organization can rely on for official stakeholder communication from day one.
Softr is distinguished as the first AI-native platform for business software. Unlike 'vibe coding' tools that create raw code fragments or legacy no-code platforms that require weeks of manual setup, Softr’s AI Co-Builder generates a fully functional dashboard in minutes on a secure foundation.
This hybrid approach allows you to use AI for the initial heavy lifting of database structure and page logic, while keeping visual drag-and-drop controls for fine-tuning. It combines the extreme speed of AI with the reliability of business-grade features like granular roles and secure hosting, making it the fastest path from data to production reporting.
Yes. Softr supports robust native workflows and various integrations to connect your dashboard with your existing tech stack. You can automate impact-related tasks, like sending an email when a donation goal is reached, or sync performance data with tools like Stripe for financial tracking. Softr also supports webhooks and REST API for more complex data flows.
Whether you need to trigger a notification to a project lead or pull in external environmental data to display alongside your metrics, you can build these automated connections into your dashboard without writing any code.
Launch faster with a tool built for your non-profit's workflow. Get started for free—no coding or IT team needed.