Track ticket volume and agent performance in an AI-powered analytics dashboard built with AI to fit your support team's workflow.
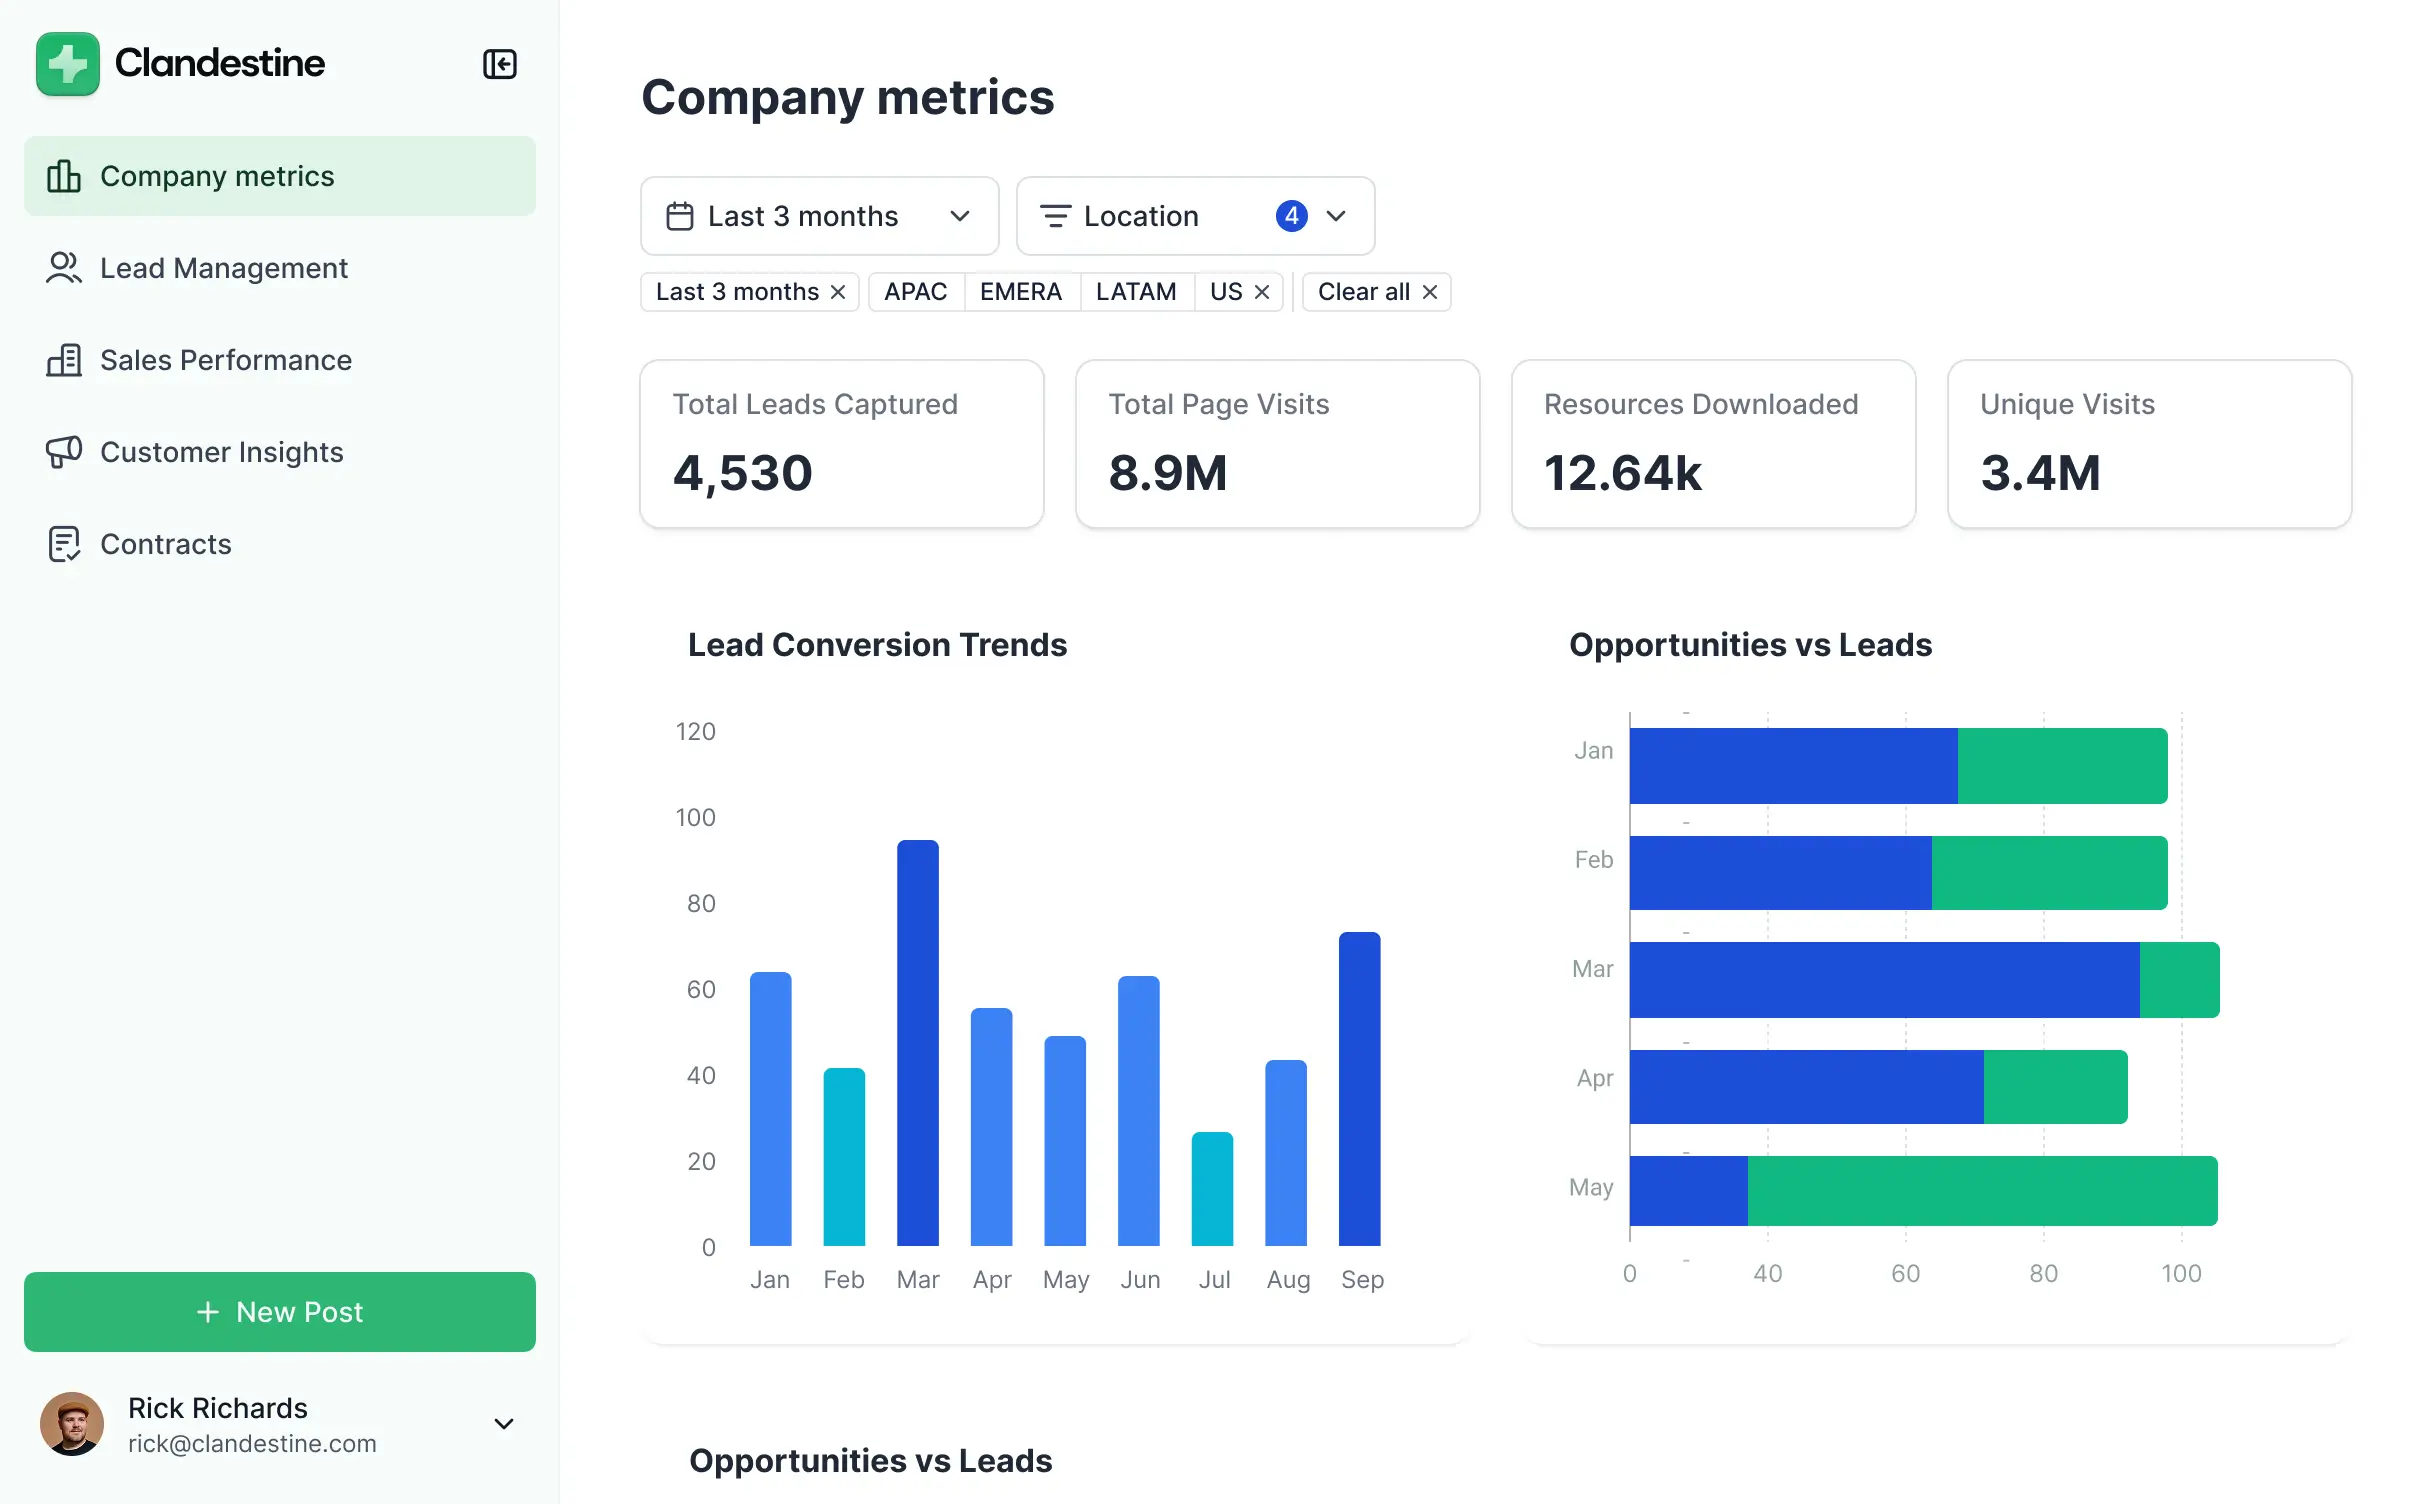

Customize your support channel analytics dashboard with the exact charts and metrics your team needs. Add new data views as processes evolve.


Connect help desk tools, spreadsheets, and custom databases with real-time sync—or manage everything in Softr Databases. Create a single source of truth for your team.
Give every manager and agent the right data and access. Set up secure logins, user groups, and granular permissions—no dev work needed.
Give different support tiers tailored dashboards, ensuring each agent or manager sees precisely the channel analytics relevant to their specific role.
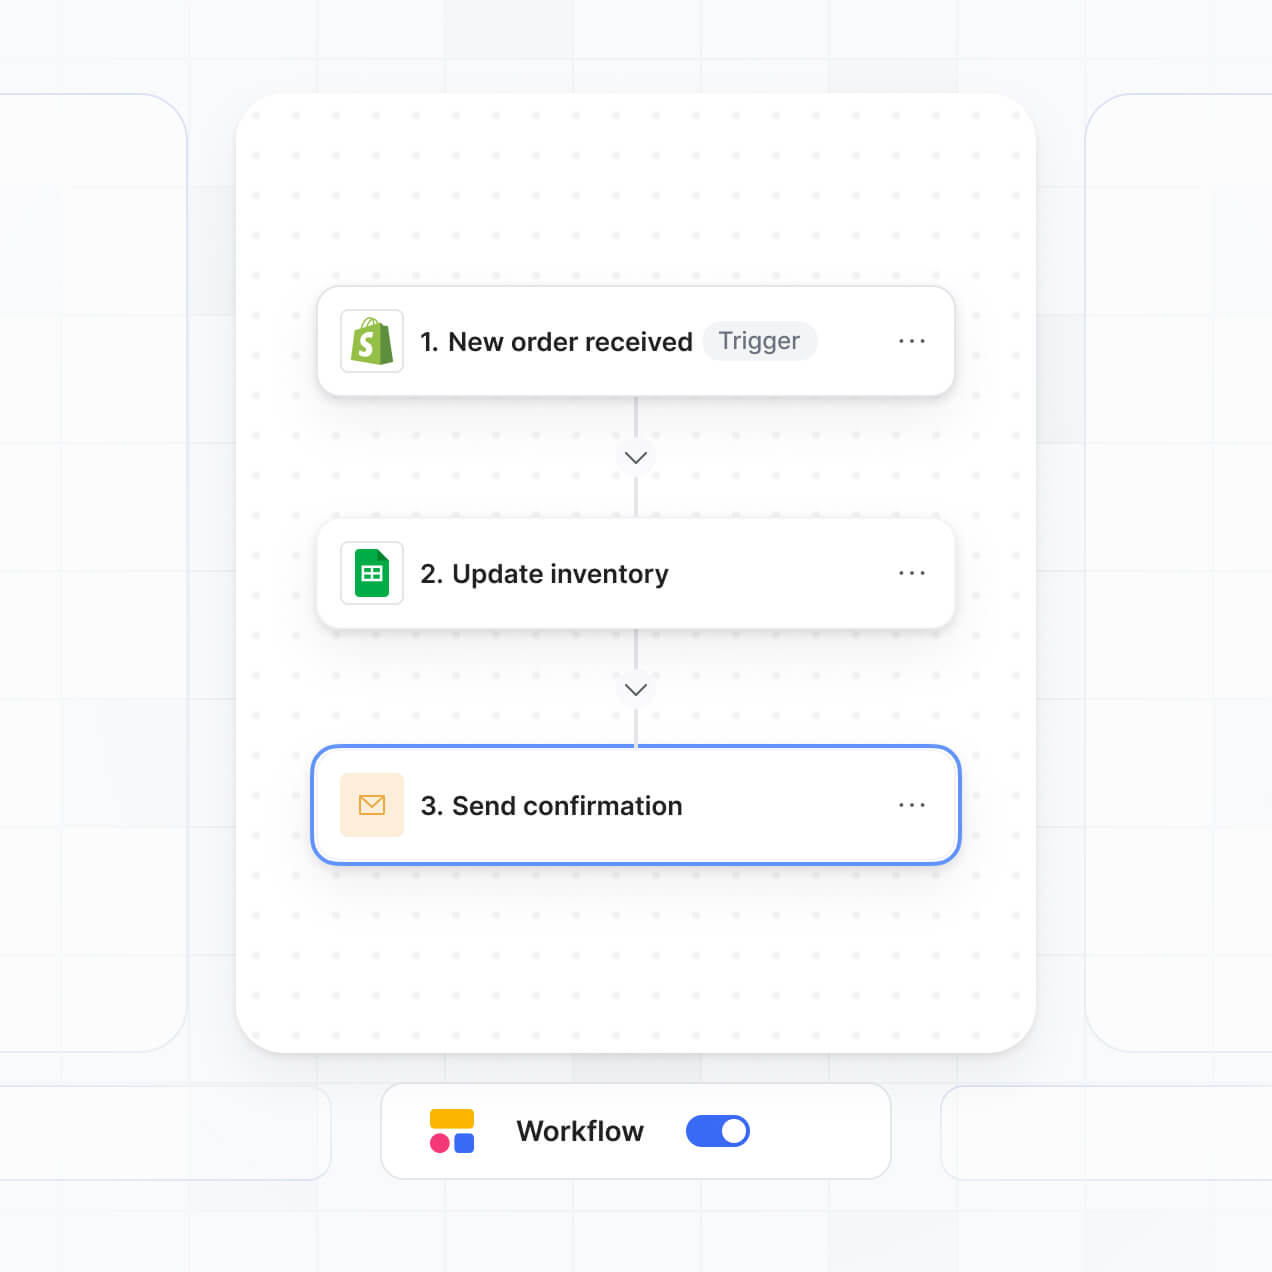
Streamline operations with Softr Workflows. Trigger native notifications or status changes based on ticket volume alerts to keep your team responsive.
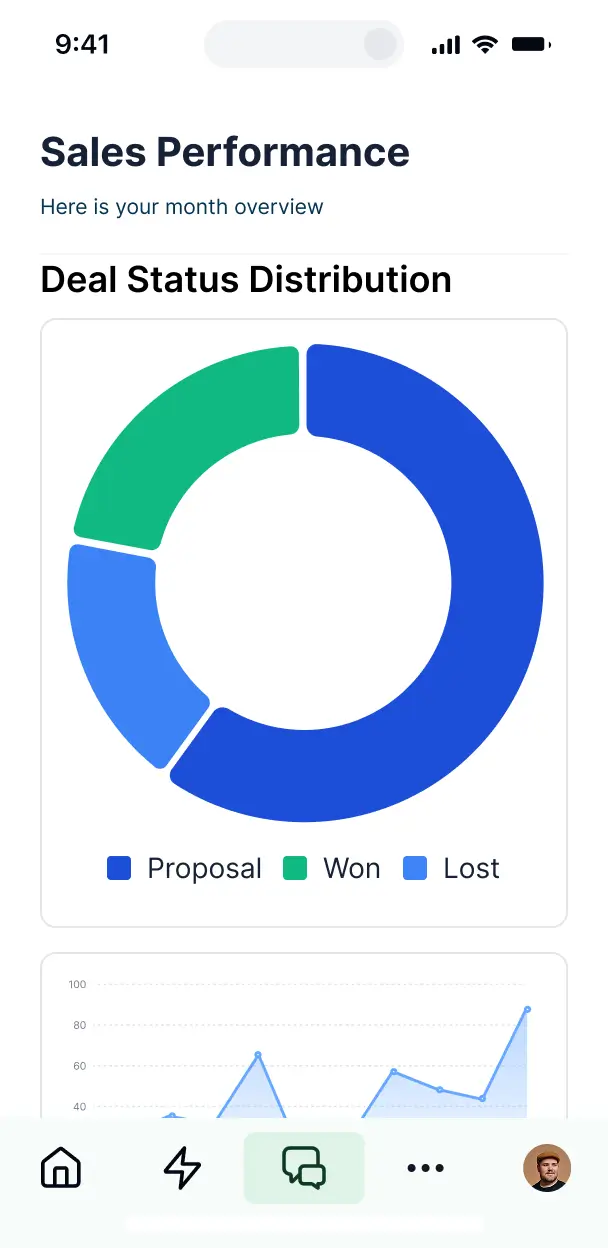
Monitor support channel performance on the go. Your dashboard and its reporting features are mobile-ready and fully responsive out of the box.
Use Google or SSO logins to give your support team fast, secure access to real-time analytics without submitting IT tickets.
Keep support and customer data safe with SOC2 and GDPR compliance, plus fine-tuned access control to sensitive channel insights.
No more one-size-fits-all tools or costly custom builds. Softr is easy to use and fully customizable, so you can launch faster, adapt as you grow, and skip the complexity of traditional software.

Build your support channel analytics dashboard in minutes with AI—no manual configuration or coding needed.

Add views for sentiment analysis or agent deep-dives as your support operations scale and evolve over time.

Start with a dashboard, then add manager portals or agent internal tools—all in one place without extra costs.
Co-build with AI
Simply describe what you need. Let Softr handle everything - Interface, database, workflows.
Iterate with AI or visually
Control most critical parts of your app yourself - roles, permissions, security.
Ship the same day
Invite team members or external clients and partners right away. No developer handover.
Use drag-and-drop blocks to build a portal that looks sleek and modern out of the box. Add only the features you need, and iterate as your workflows evolve.




A support channel analytics dashboard is a centralized reporting hub where support managers and team leads can monitor performance metrics across platforms like email, chat, and social media. It centralizes volume trends, response times, and CSAT scores in one view, effectively replacing the need to manually export data from various helpdesk tools or juggle complex spreadsheets.
Softr is the first AI-native platform for building business software, making it the ideal choice for creating a support channel analytics dashboard tailored to your specific service level agreements (SLAs). You can describe your reporting needs to the AI Co-Builder to instantly generate a tracking database, performance pages, and visualization logic—all fully connected and secure.
You don't need to code anything. You can start by generating with AI, using a dashboard template, or building from scratch. Everything runs on Softr Databases, the native, relational database built into the platform, or you can connect your existing helpdesk data from external tools like HubSpot, Airtable, or Google Sheets. You have full control to adjust the data visualization components, define who can see specific performance benchmarks, and brand the dashboard to match your internal tools.
You can include a wide range of features in your support channel analytics dashboard to ensure your team hits its KPIs. A great dashboard usually mixes visualization blocks with AI-powered intelligence:
- AI-Powered Intelligence – Use Ask AI to let managers query ticket trends via natural language, or set up Database AI Agents to automatically categorize ticket sentiment or identify recurring customer pain points.
- Vibe Coding Blocks – Build custom UI elements—like a real-time agent leaderboard or a heat map of ticket volume by hour—using the AI Code block to "vibe code" exactly what your operational team needs.
- Softr Workflows – Build native automations, such as an alert that triggers a Slack notification when average response time exceeds a specific threshold.
- User Portals & Logins – Securely manage access so agents see their personal performance stats while managers access the full department-wide view.
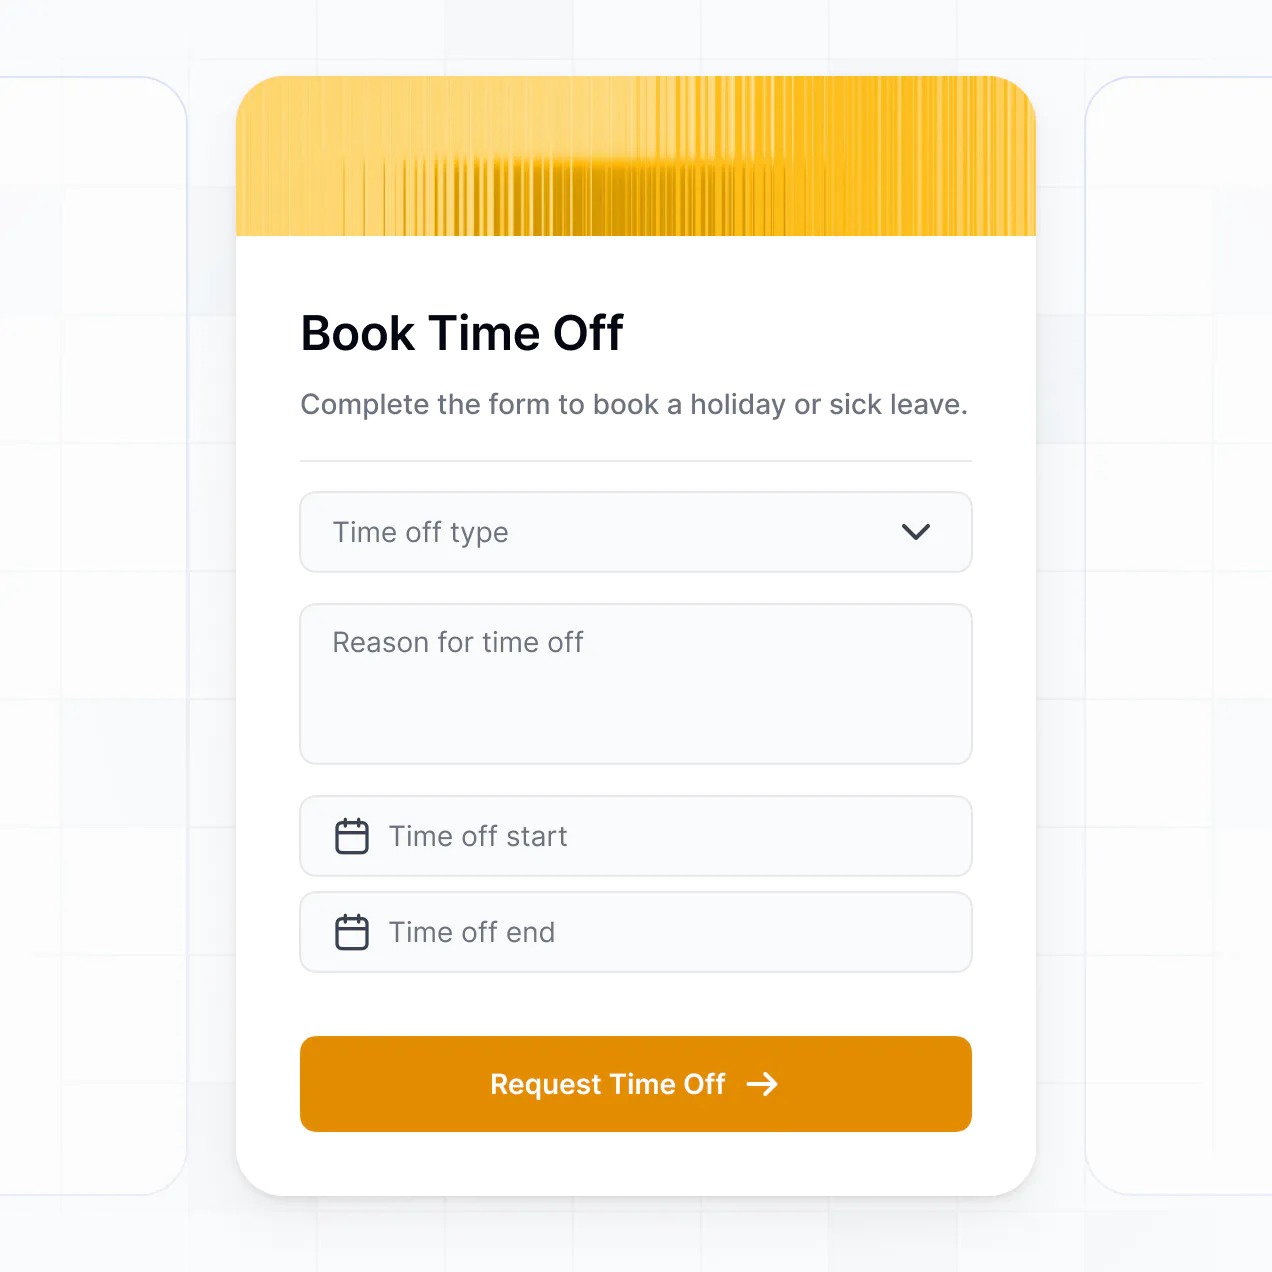
- Forms & Data Collection – Capture weekly retrospective notes or quality assurance scores directly within the dashboard.
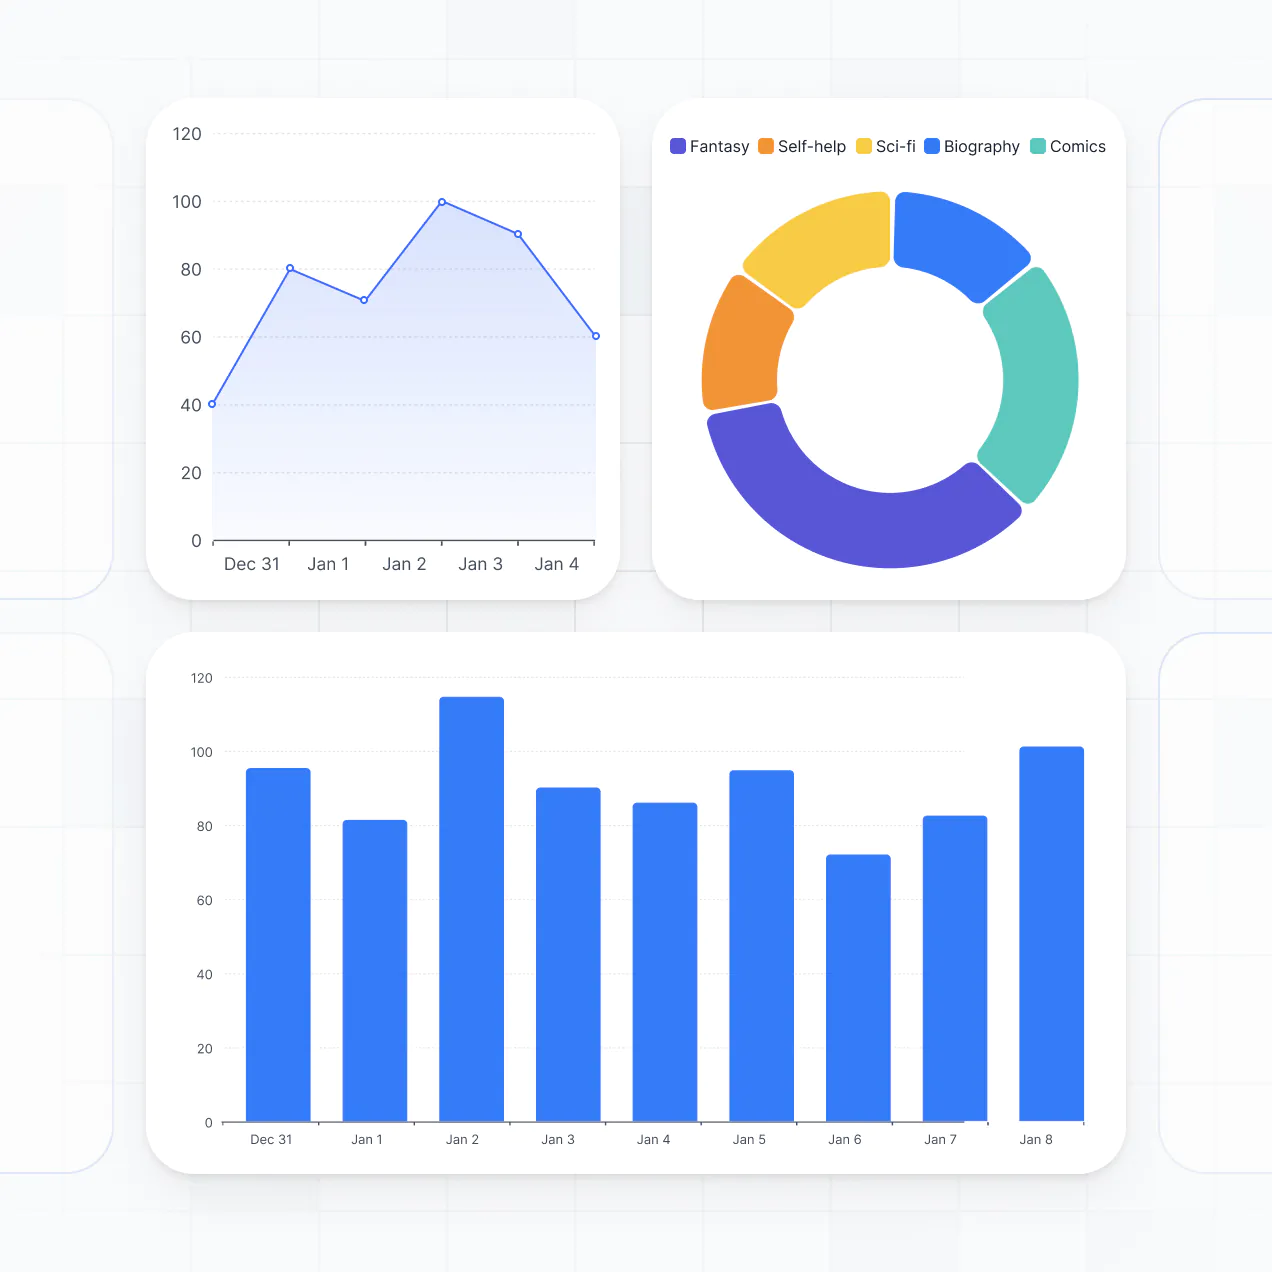
- Dashboards & Charts – Visualize ticket volume by channel, resolution rates, and agent efficiency with real-time charts.
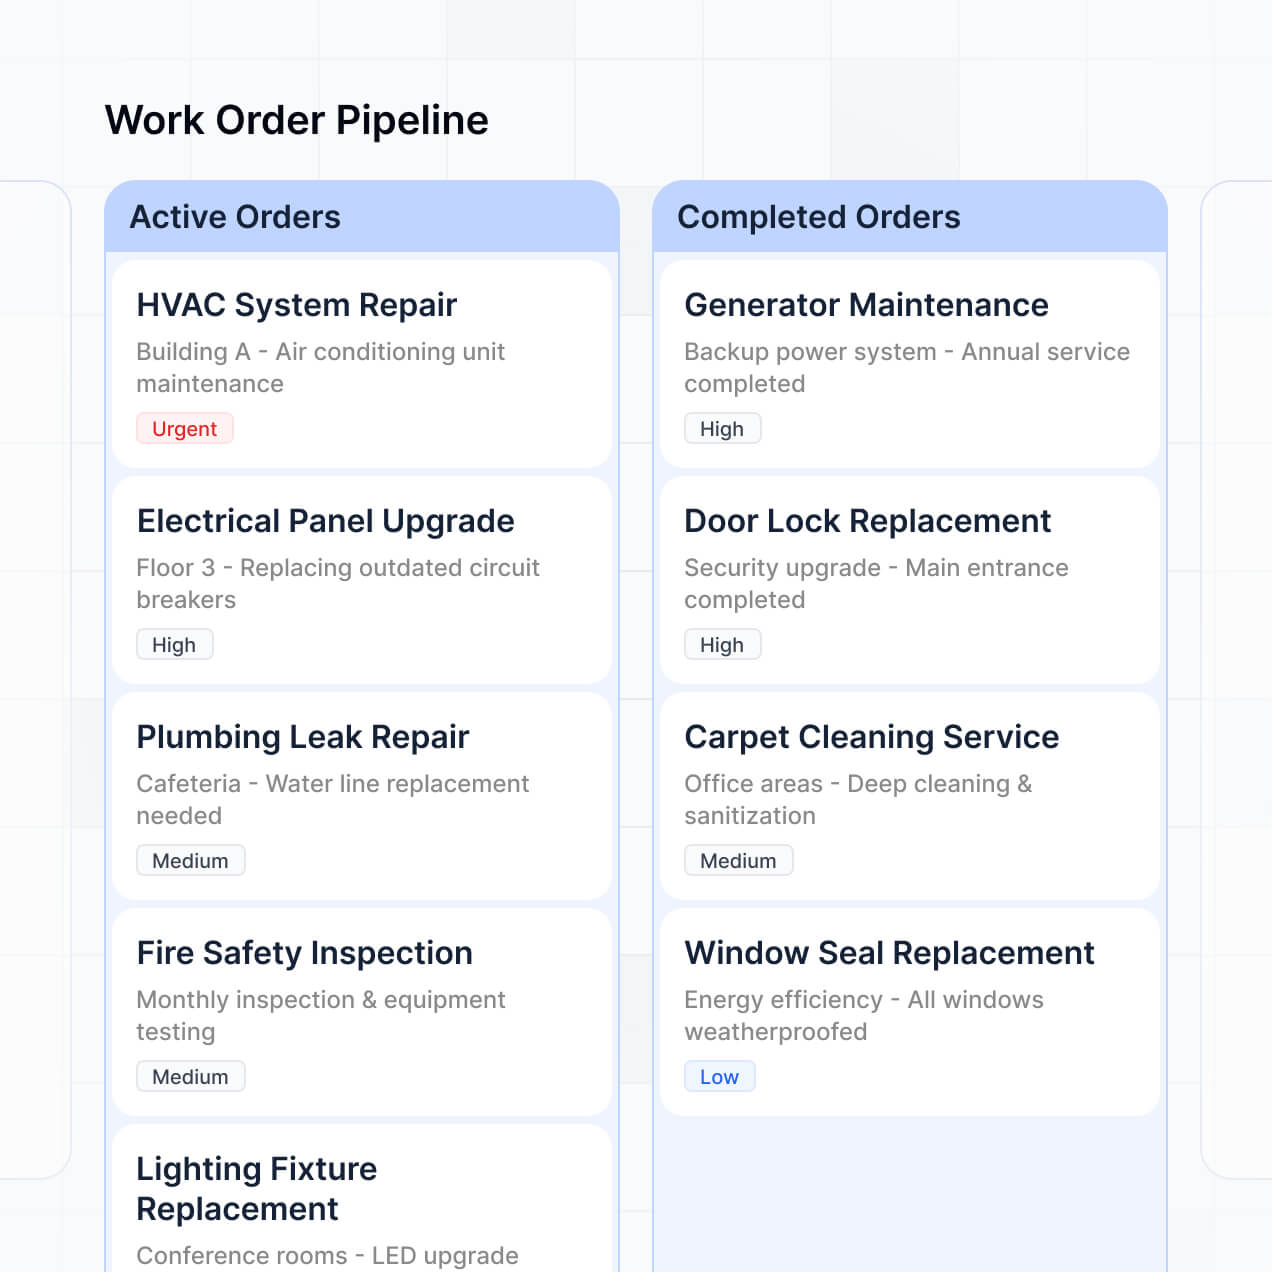
- Lists & Advanced Filtering – Display and manage high-priority tickets with searchable tables and detailed log views.
Vibe coding is about moving fast and using AI to build the specific reporting views you need. You can "vibe code" a support channel analytics dashboard in Softr by simply describing your required metrics—like first-response time or channel distribution—to the AI Co-Builder. Softr then generates a production-ready reporting app on top of a stable foundation.
While other tools generate fragile code that breaks when your data grows, Softr handles the foundational logic—like data synchronization and user authentication—natively. This means you get the speed of vibe coding your custom visualizations without the technical debt of managing raw code. You describe the support metrics you want to track, and Softr builds a secure, interactive dashboard instantly.
Yes. You can manage data for multiple support tiers, regional teams, or product lines in a single dashboard. Each user only sees the performance metrics and ticket data assigned to them based on their login and role. This is particularly useful for global companies or outsourced support partners where data isolation between different stakeholders is critical.
Yes, you can. You don't need to have an existing BI tool or database to start building with Softr. If you are starting your reporting journey from scratch, you can use Softr Databases, which is built into the platform and allows you to log and track support interactions directly within the app you build.
However, if you already have support ticket data in tools like HubSpot, Airtable, Google Sheets, or Zendesk (via API), you can connect those as well. You have full control over how your ticket records are structured and visualized, ensuring your reporting is as granular as your support operations require.
Softr Databases is the recommended native data source, offering high performance for real-time ticket tracking and instant automation triggers. Because the data is native to the platform, your dashboard stays fast even as your ticketing history grows.
If your support data lives in other apps, Softr connects to 17+ external sources including Airtable, HubSpot, Google Sheets, and SQL databases. You can even mix data sources—pulling agent payroll data from one source and ticket performance from another—into the same display. Most sources support real-time, two-way sync, so when a ticket status changes in your helpdesk, the dashboard reflects it automatically.
Yes, Softr provides granular control over how your team interacts with the support channel analytics dashboard. You can customize the layout and metrics shown to match your specific support workflow. Each chart or data table can be shown or hidden based on the user's role, so agents only see their personal KPIs while directors see financial impact reports.
You can set up multiple roles—such as Agent, Manager, or Admin—and define exactly what each can view or edit. For instance, you can allow managers to export CSV reports while restricting agents to a read-only view of their individual throughput. This keeps your sensitive company performance data secure while empowering the team with the insights they need.
Yes, you can fully white-label your support analytics dashboard in Softr. You can apply your company's logo, custom CSS, brand colors, and host it on your own subdomain (e.g., reports.yourcompany.com). By removing Softr branding, the dashboard feels like an internal proprietary tool built specifically by your IT or Ops department.
Yes, you can. Softr gives you total flexibility to control the visual hierarchy of your support metrics. You can adjust the themes, spacing, and page structure to ensure high-priority data points like 'Open High Priority Tickets' are front and center.
You can choose from various blocks to display your support data effectively:
- Table blocks – to show detailed ticket logs, active escalations, or agent shift schedules.
- List or Card blocks – to highlight individual agent profiles or top-performing support articles.
- Detail View – to drill down into a specific channel's performance or an individual ticket's history.
- Forms – to allow managers to submit quality reviews or feedback.
- Charts – to visualize trends in ticket volume, wait times, and resolution rates.
- Calendar blocks – to track support coverage and upcoming product launches.
Updates are made via a visual drag-and-drop builder, making it easy to iterate your reporting as your support team scales.
Softr is built with enterprise-grade security. All support data is encrypted in transit and at rest, and hosted on secure infrastructure. Your dashboard gives you full control over data visibility via role-based permissions, ensuring sensitive customer information is only accessible to authorized personnel.
If you use Softr Databases, your data is stored in a secure environment in Germany with SOC 2 Type II compliance. For external connections to helpdesks like HubSpot or SQL, Softr serves as the interface and does not store the data itself, pulling it in real time based on your specific access rules. This multi-layered approach keeps your customer communication data safe and compliant with privacy standards.
It is fully production-ready. While many AI tools merely generate a visual mockup or fragile code, Softr builds your support analytics dashboard on a scalable foundation designed for business use.
We provide the critical infrastructure—like secure user authentication, granular data permissions, and reliable hosting—natively. This ensures that the moment your AI Co-Builder finishes generating your app, it is ready to handle real support data and be used by your entire support organization without worrying about bugs or security gaps.
Softr is the first AI-native platform designed specifically for business software. Unlike simple BI tools that only offer static visualizations, or complex no-code tools that require weeks of training, Softr’s AI Co-Builder generates a fully functional app with built-in logic and user management in minutes.
The hybrid advantage allows you to use AI to generate your support database and reporting logic instantly, then use the visual editor for fine-tuning. You get the speed of AI generation with the reliability of built-in business features like logins and permissions, allowing support teams to go from a data mess to a production dashboard on day one.
Yes. Softr supports powerful native workflows and integrations to bridge the gap between your data and your actions. You can automate tasks like sending a weekly performance summary to a manager or triggering an SMS via Zapier when a ticket is overdue. Softr also supports the REST API and webhooks for deeper connections with your helpdesk stack.
Whether you need to sync data with Jira for bug tracking, process agent bonuses via Stripe, or pull customer data from Intercom, you can build these workflows directly into your dashboard without writing a single line of code.
Go from idea to a live support channel analytics dashboard in under an hour. Build and customize without code today.