


An organizational chart is one that visually represents the hierarchy within an organization and shows the relationship between its employees. You can create an organizational chart in Google Sheets and share it with everyone in your organization so that they understand their responsibilities and roles.
Making an organizational chart in Google Sheets, using its chart editor
Cost: $0
Time: 4 minutes
Making an organizational chart in Google Sheets, using the inbuilt Chart editor, allows you access to a variety of customization options, including layout, design, and color. Also, you can easily provide access to your org chart, so that any changes are seen in real-time.
Step 1: Select the data
Select the data you want to use to create an org chart, by clicking and dragging over the cells in your sheet in Google Sheets.

Step 2: Open the chart editor
In the menu bar, click on the "Insert" option and select "Chart" to open the chart editor panel.

Step 3: Select the org chart type
In the setup menu of the chart editor panel, click on the dropdown arrow to find “Organizational Chart.” Once you do, out of all the types of charts listed, click on the org chart.

Step 4: Setup the organizational chart
By now, you already have a shart in your Google Sheet, but you can still improve it. On the right side, in the chart editor panel, you have two checkboxes:
- Switch rows/columns: This allows you to transpose the data in the chart. This means that the rows would become columns, and the columns would become rows. This can be useful if you want to change the orientation of the chart or if you want to switch the hierarchical relationship of the data;
- Use row 1 as headers: This means that the first row of the data will be used as the header row for the chart. This is useful if the first row contains the names of the columns. This is our case: "Position" and "Reports to".

Step 5: Customize your organizational chart
To customize your org chart, click on “Customize” in the Chart editor. Then click on “Org” to display the editing options. There, you have the option to change the size of the chart and the color of the nodes.

Step 6: Save your organizational chart
You can choose one of many methods to save the org chart you made in Google Sheets. To access all the methods available to do so, click on the three dots that appear in the top right corner of your chart.

Step 7: You’ve made an org chart in Google Sheets
Congratulations! By following all of the above steps, you’ve made an organizational chart in Google Sheets!

Making an organizational chart with your data in Google Sheets, using Softr
Time: 5 minutes
Cost: $0
You can also use Softr to create your organizational charts. By using this method, you will gain access to features unavailable in Google Sheets but retain the possibility of using your data in Google Sheets.
Step 1: Log in to Softr or create an account
First, you will need to log in to Softr. If you don’t have an account, you can sign up for Softr for free.

Step 2: Click on "New Application"
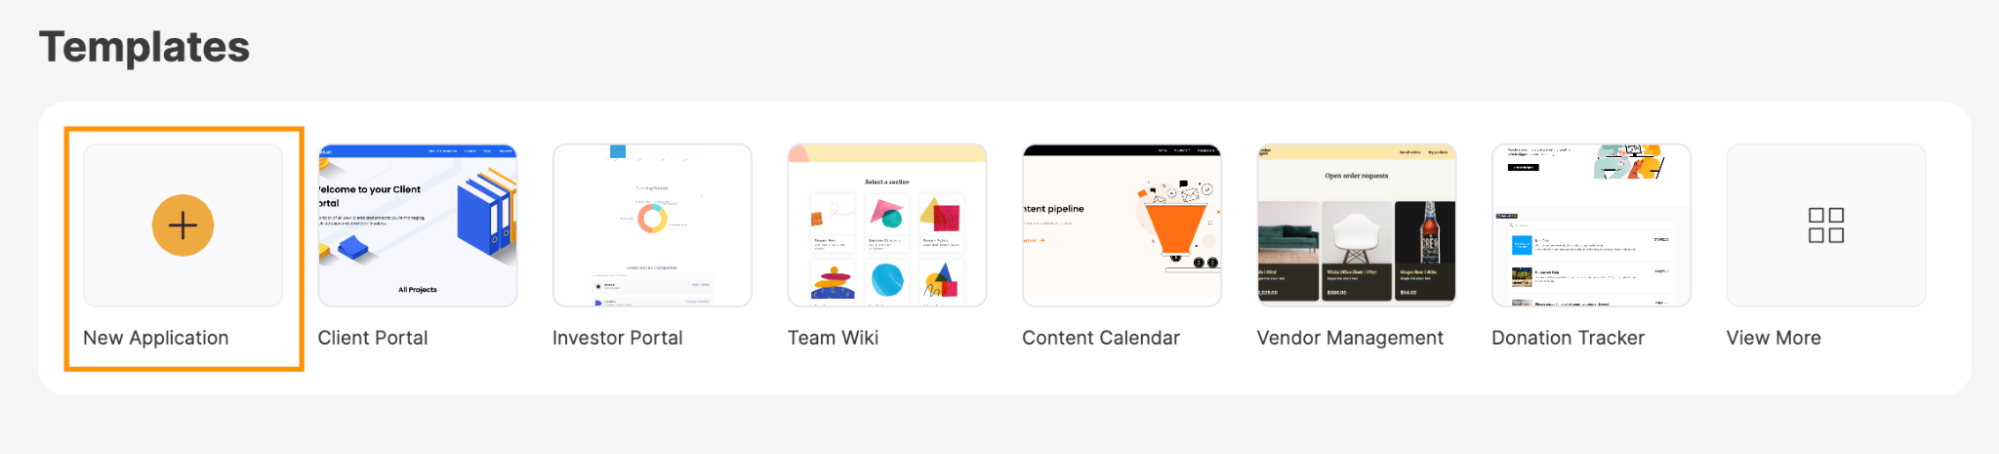
With your Softr account set up, it's time to create a new application where your graph will be housed.
On your Softr dashboard, locate and click on the "New Application" button.
Step 3: Search for a template
Softr offers a wide variety of templates that can simplify the process of making an organizational chart with your data in Google Sheets. For this purpose, I recommend the Employee Directory Template. Locate and select it to proceed.

Step 4: Click on "Use Template"
You can now learn more about the Employee Directory Template, including its features and functionalities. Once you’re ready, click on the "Use Template" button.

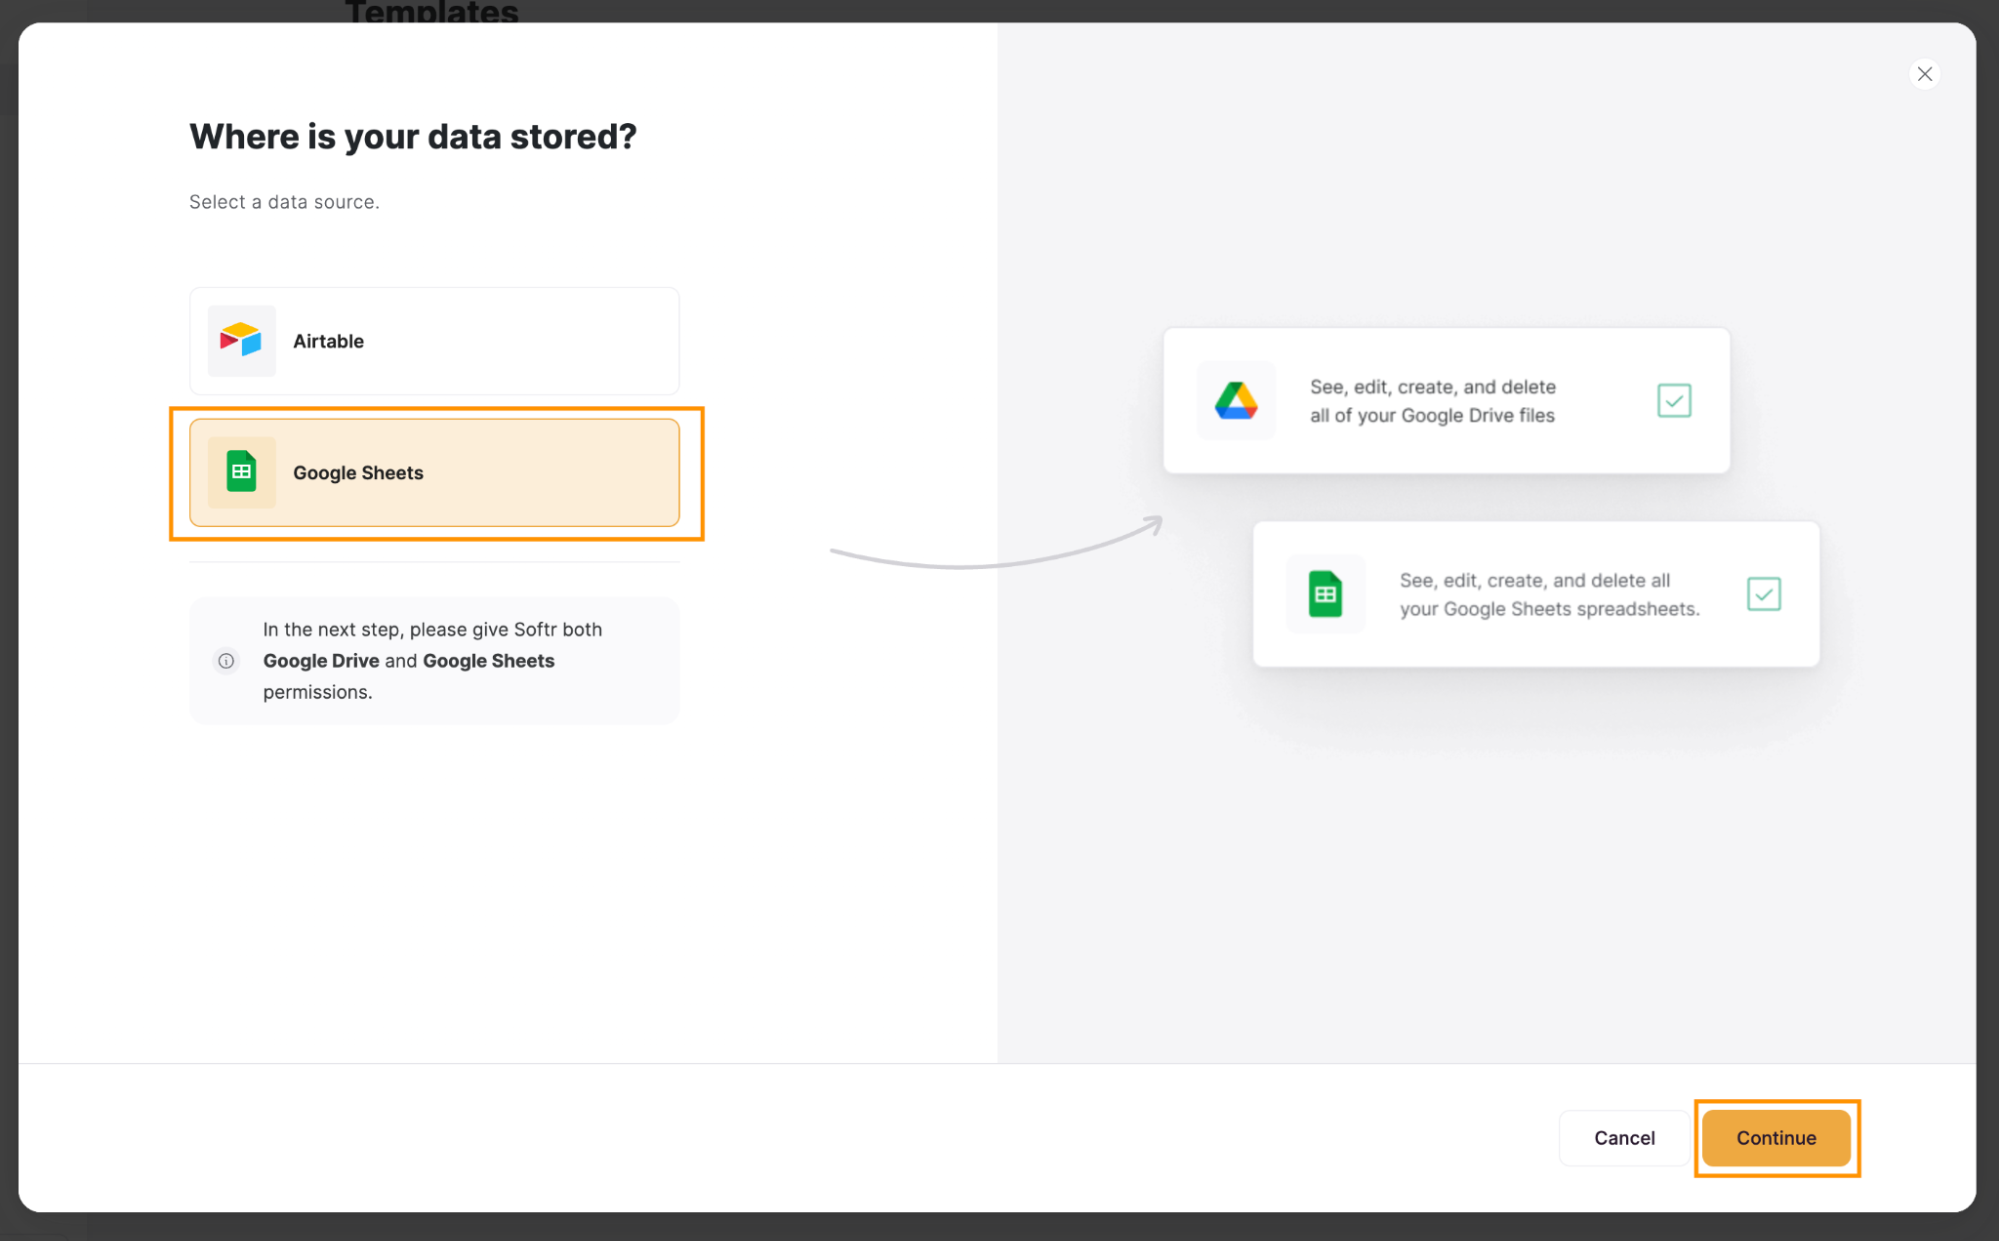
Step 5: Select Google Sheets as the data source
Next, you'll be prompted to choose a data source. Because you want your org chart to use data stored in Google Sheets, select "Google Sheets" from the available options, and click on "Continue."
Step 6: Connect to Google Sheets
Now, you have to connect your Softr app with your Google Account. To do so, follow the next steps.
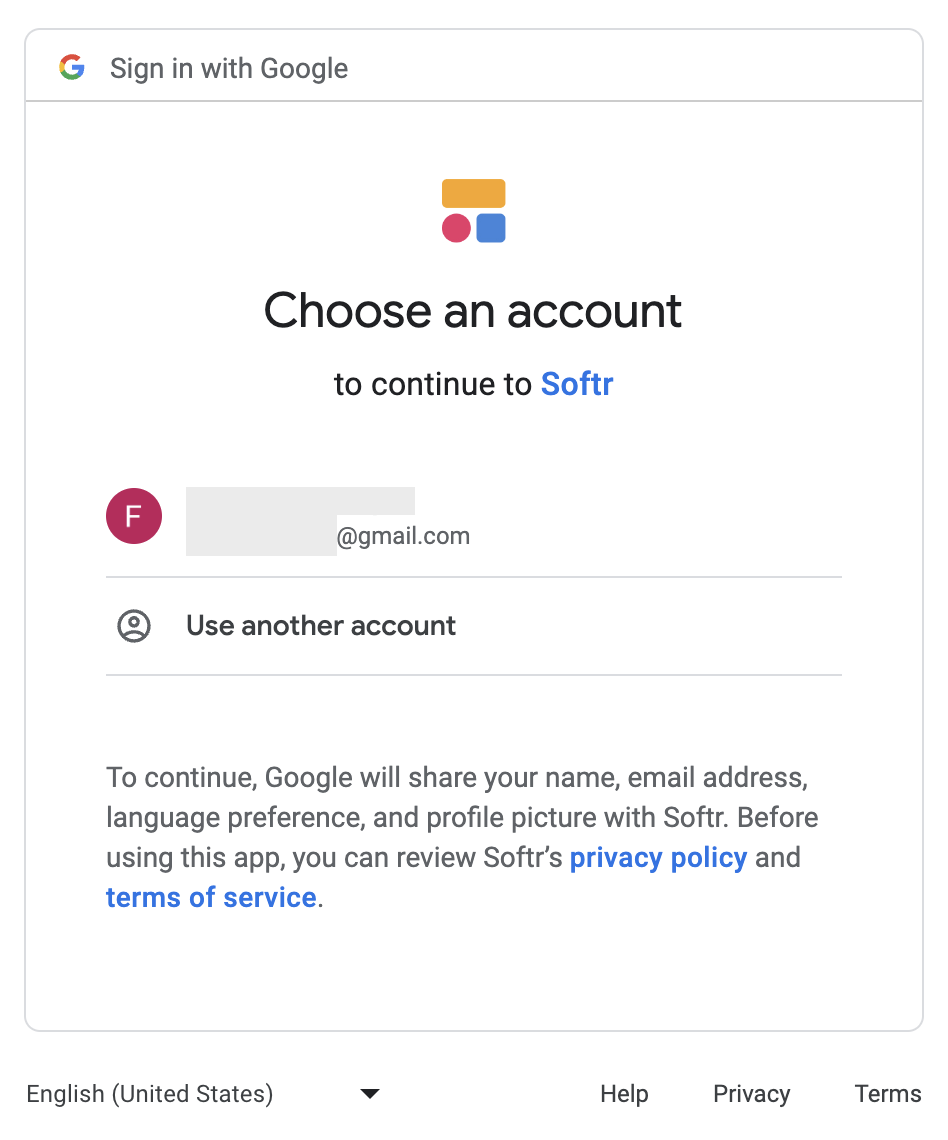
Step 6.1: Select a Google Account
A new window or tab will open for you to log in to or select your Google Account.
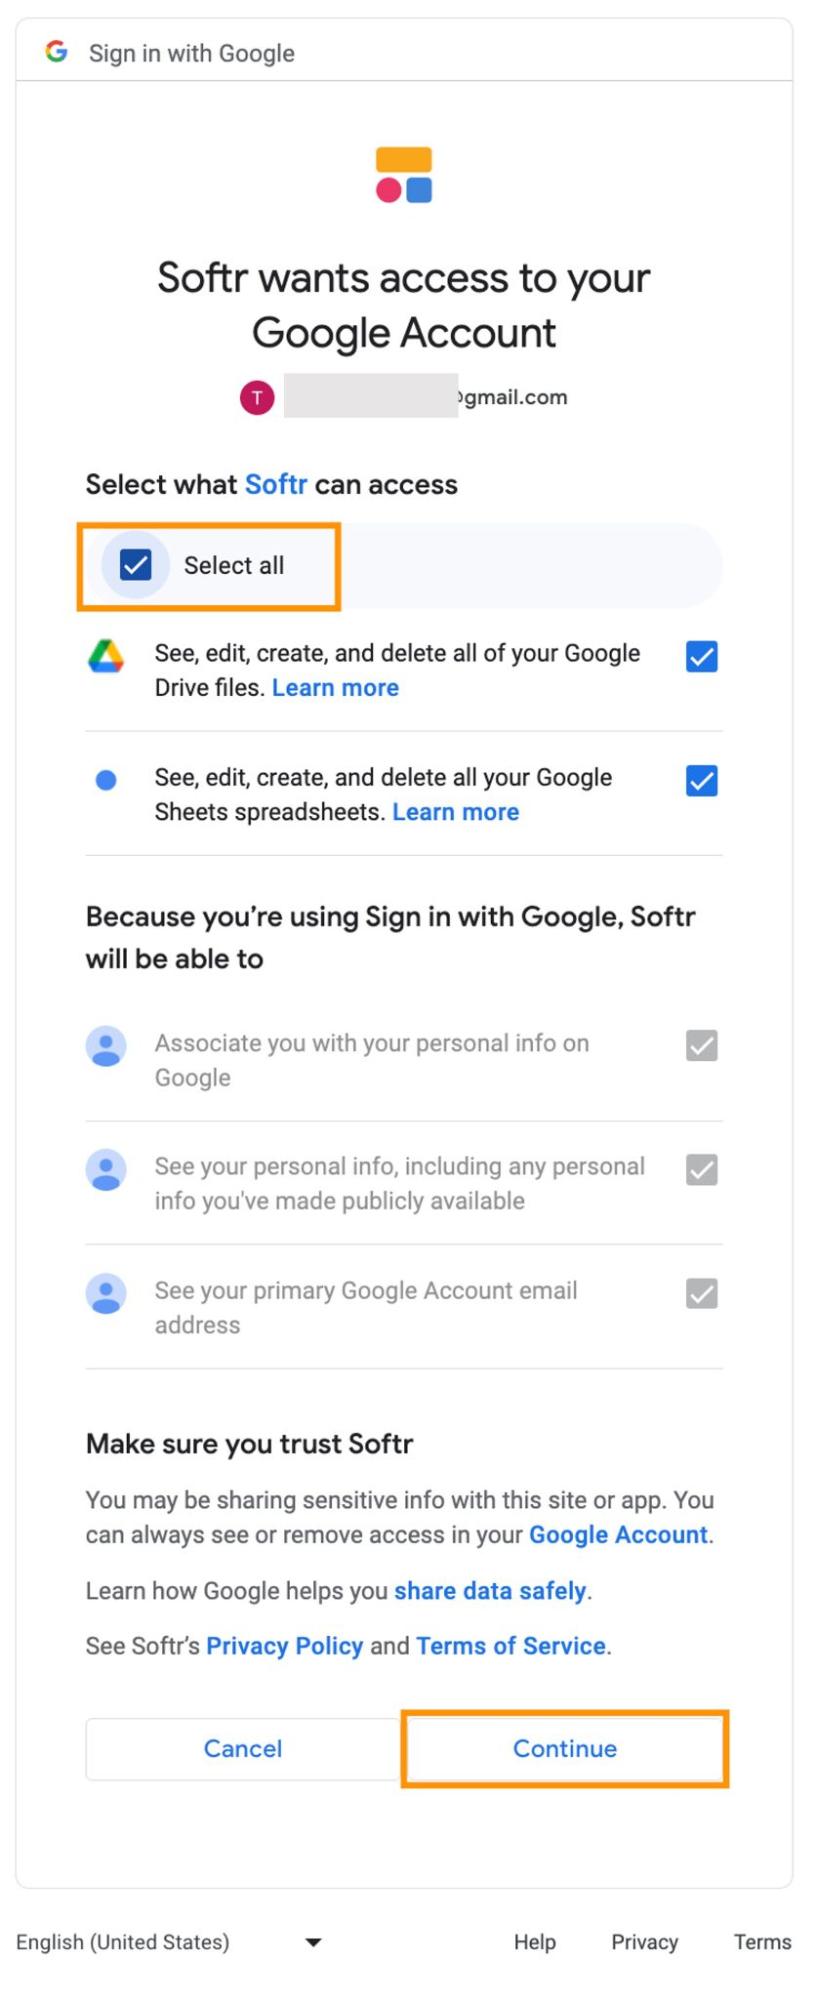
Step 6.2 Grant additional access
In this step, you’ll need to grant Softr access to a set of features. Click on "Select all" and then hit “Continue."
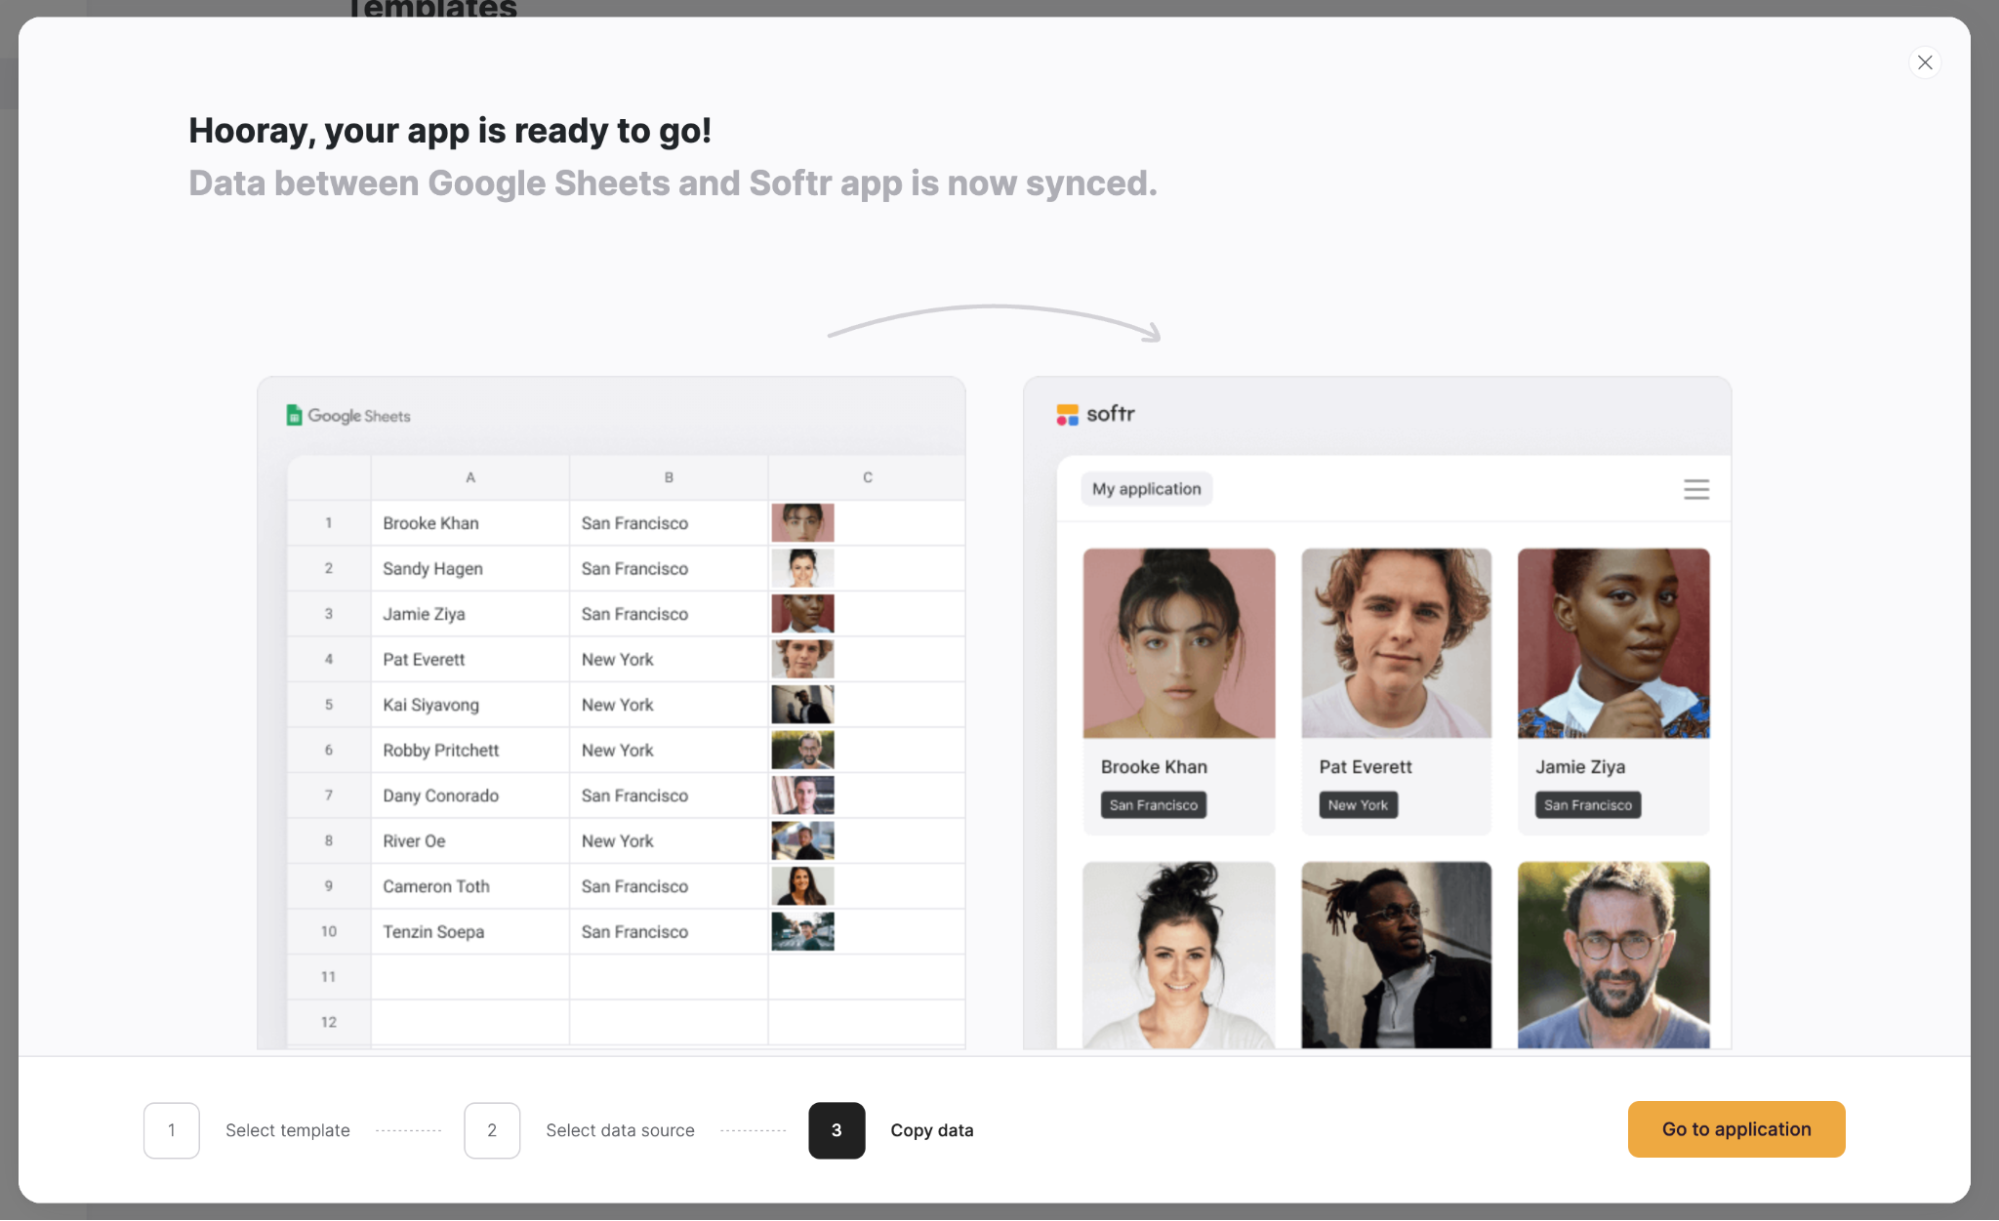
Step 6.3: Go to your app
Now that your Google account is connected with Softr, click on “Go to application".
Step 7: Access the organizational chart
Before you, you now have a complete directory template, which includes an organizational chart. To access the latter, click on “Pages” on the left sidebar, then click on “Organisational Chart.”

Step 8: Connect the organizational chart with your Google Sheets data
In order for the organizational chart to display the data you have stored in your Google Sheets file, you need to indicate where exactly that data is located. To do so, click on the organizational chart to open a sidebar on the right side of your screen. There, you will need to select the spreadsheet and the sheet where your data is by clicking on the "Document" and "Sheet" options.

Step 9: Adjust the title and subtitle
Using the sidebar on the right side of your screen, under the FEATURES tab, you can change the title and subtitle of your organizational chart.

Step 10: Map the fields
Next, you need to indicate which data field in your Google Sheets file corresponds to what information. You can do this in the FEATURES tab, under the ORG CHART-SETTINGS heading.

Step 11: Style your chart
Softr allows you to style your organizational chart in a few ways.
Step 11.1: Customize Padding and Margins
To customize the padding at the top and the bottom of your chart, go to the STYLES tab and adjust either padding under the PADDINGS & MARGINS heading.

Step 11.2: Customize Border
By scrolling down in the STYLES tab, you can find the General section. There, you can customize the chart’s background color, as well as the color, type, and thickness of the borders.

Step 12: Adjust access permissions
You can choose to control who has access to your organizational chart. You can allow either all users, logged-in users, or non-logged-in users. You can adjust this setting in the VISIBILITY tab.

Step 13: Save your changes
Once you've configured your organizational chart, you need to save your changes, so that it’s accessible to other users. You can do so by clicking on “Publish” in the top right corner of your screen.

Step 14: You’ve created an organizational chart!
Congratulations! Using your Google Sheets data and Softr, you’ve created a highly customizable organizational chart that you can share with your team.

What is Softr
Softr is the easiest way to turn your data into powerful business apps—no code required. Connect to your spreadsheet or database, customize layout and logic, and share with your team or clients.
Join 700,000+ users worldwide, building client portals, internal tools, CRMs, dashboards, project management systems, inventory management apps, and more—all without code.
Join 700,000+ users worldwide, building client portals, internal tools, CRMs, dashboards, project management systems, inventory management apps, and more—all without code.
Get started free

Minnie Mururi


Categories


