


Airtable is a powerful datum visualization tool that transforms how teams store, organize, and manage historical and current data.
Still, looking at the spreadsheet-database interface can get quickly overwhelming. I personally have hours digging through different bases to try and find the information I need.
Luckily, custom reports cut down on the clutter so that you can visualize your data to paint a clear picture that you and all stakeholders can actually understand.
Airtable users can set up a visual report in the app itself, or with a free, easy Airtable extension.
This step by step guide walks through the best ways to create reports and build powerful charts.
What are Airtable reports?
Think of a visual report as a clear outline of your data in real-life context.
It gives us (and other stakeholders) a top of view perspective on our performance against target metrics through report tables, charts, graphs and other visual indicators.
Basically, a summary report lets us capture a snapshot of our data in order to:
- Use in presentations to leadership;
- Quickly spot trends over time;
- Track progress on project management efforts;
- Create different chart types (such as a pie chart or pivot table) to monitor budgets, total hours, all tasks, and more.
Currently, Airtable's core functionality offers limited ways to help you visualize your datum.
Luckily, you can still create a custom report through an internal Airtable extension, or through a report extension like Softr — a free datum visualization tool with advanced customization and security features.
Creating a report with Airtable Interface Designer
To help users create graphs, charts, and other visualizations from their Airtable data, Airtable released its Interface Designer.
Why use Airtable Interface Designer
This internal report extension is easy to set up and use. It's a great data fetcher that lets you build report tables and different chart types connected to top of view insights.
The Interface Designer is available on the free plan, but some features, such as granular permissions and advanced controls, are reserved for paid plans starting at $20/month.
Set up a report with Interface Designer
Follow the next steps to learn how to create your report with the Interface Designer.
Step 1: Click on “Interfaces”
In your Airtable base, click on the “Interfaces” tab at the top of the screen.

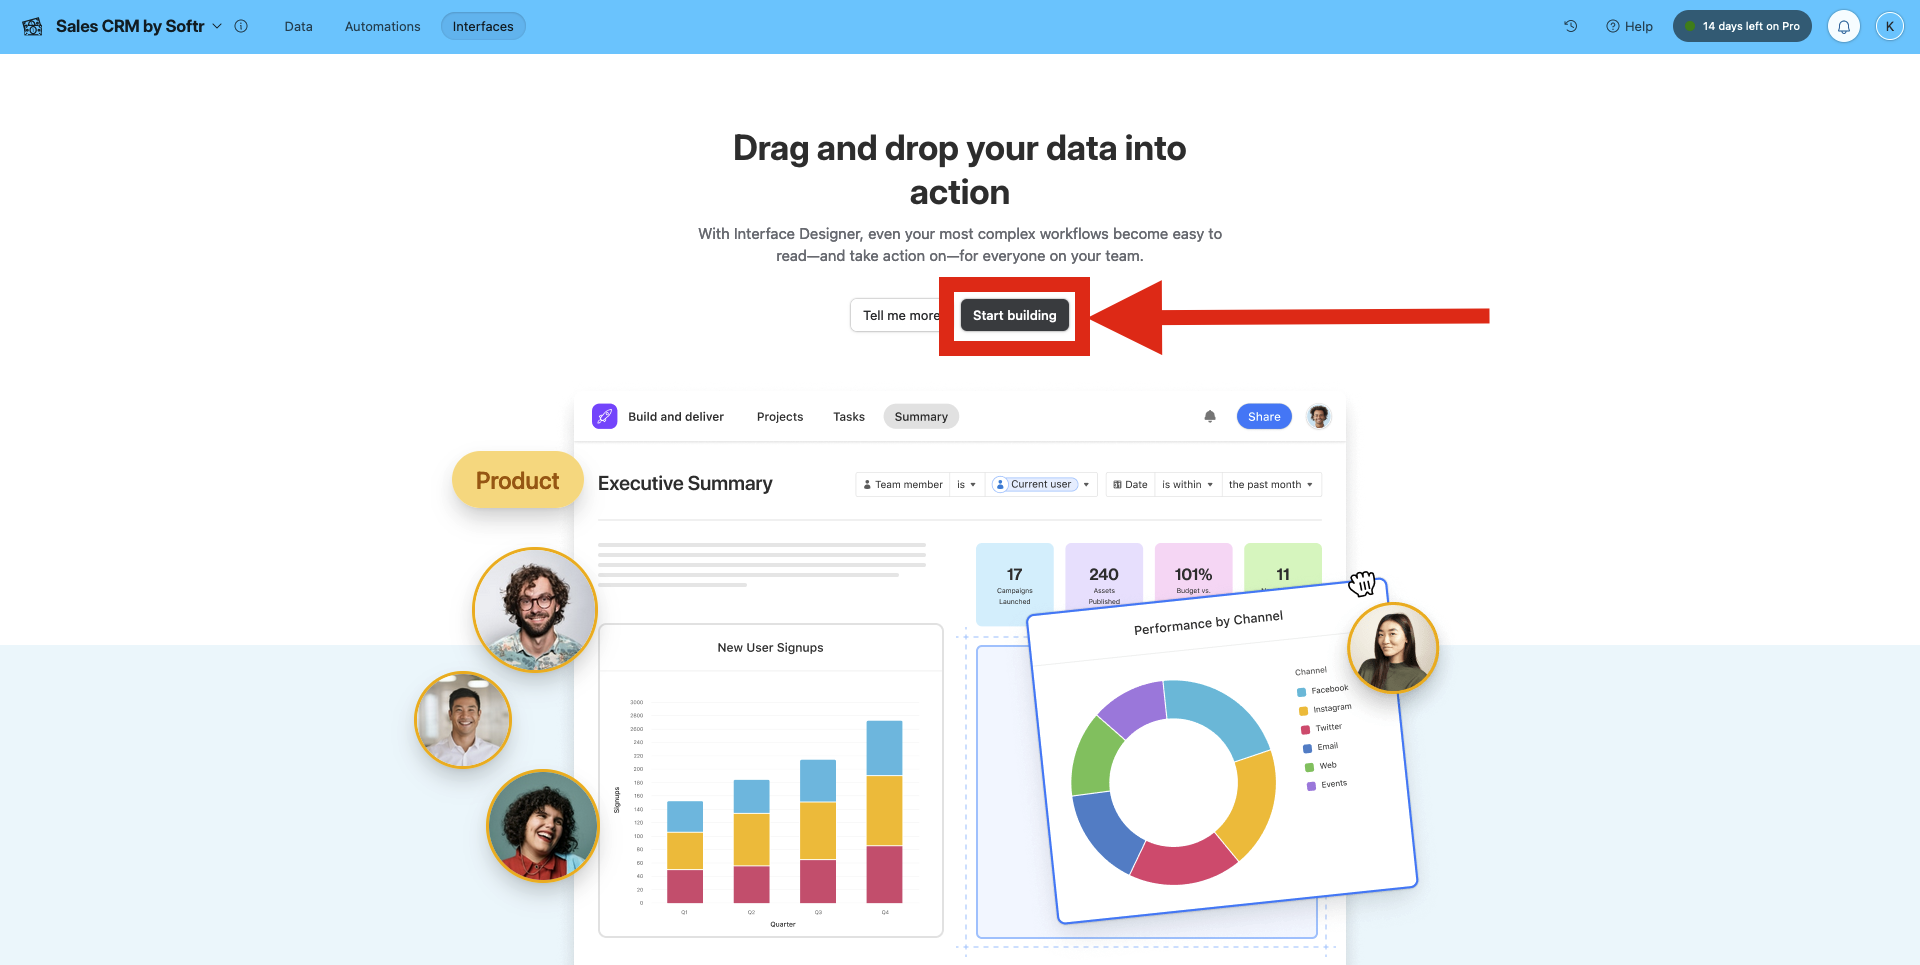
Step 2: Click on “Start building”
On this page, you have the opportunity to learn more about the page designer.
Once you’re ready to create a report, click the “Start building” button.
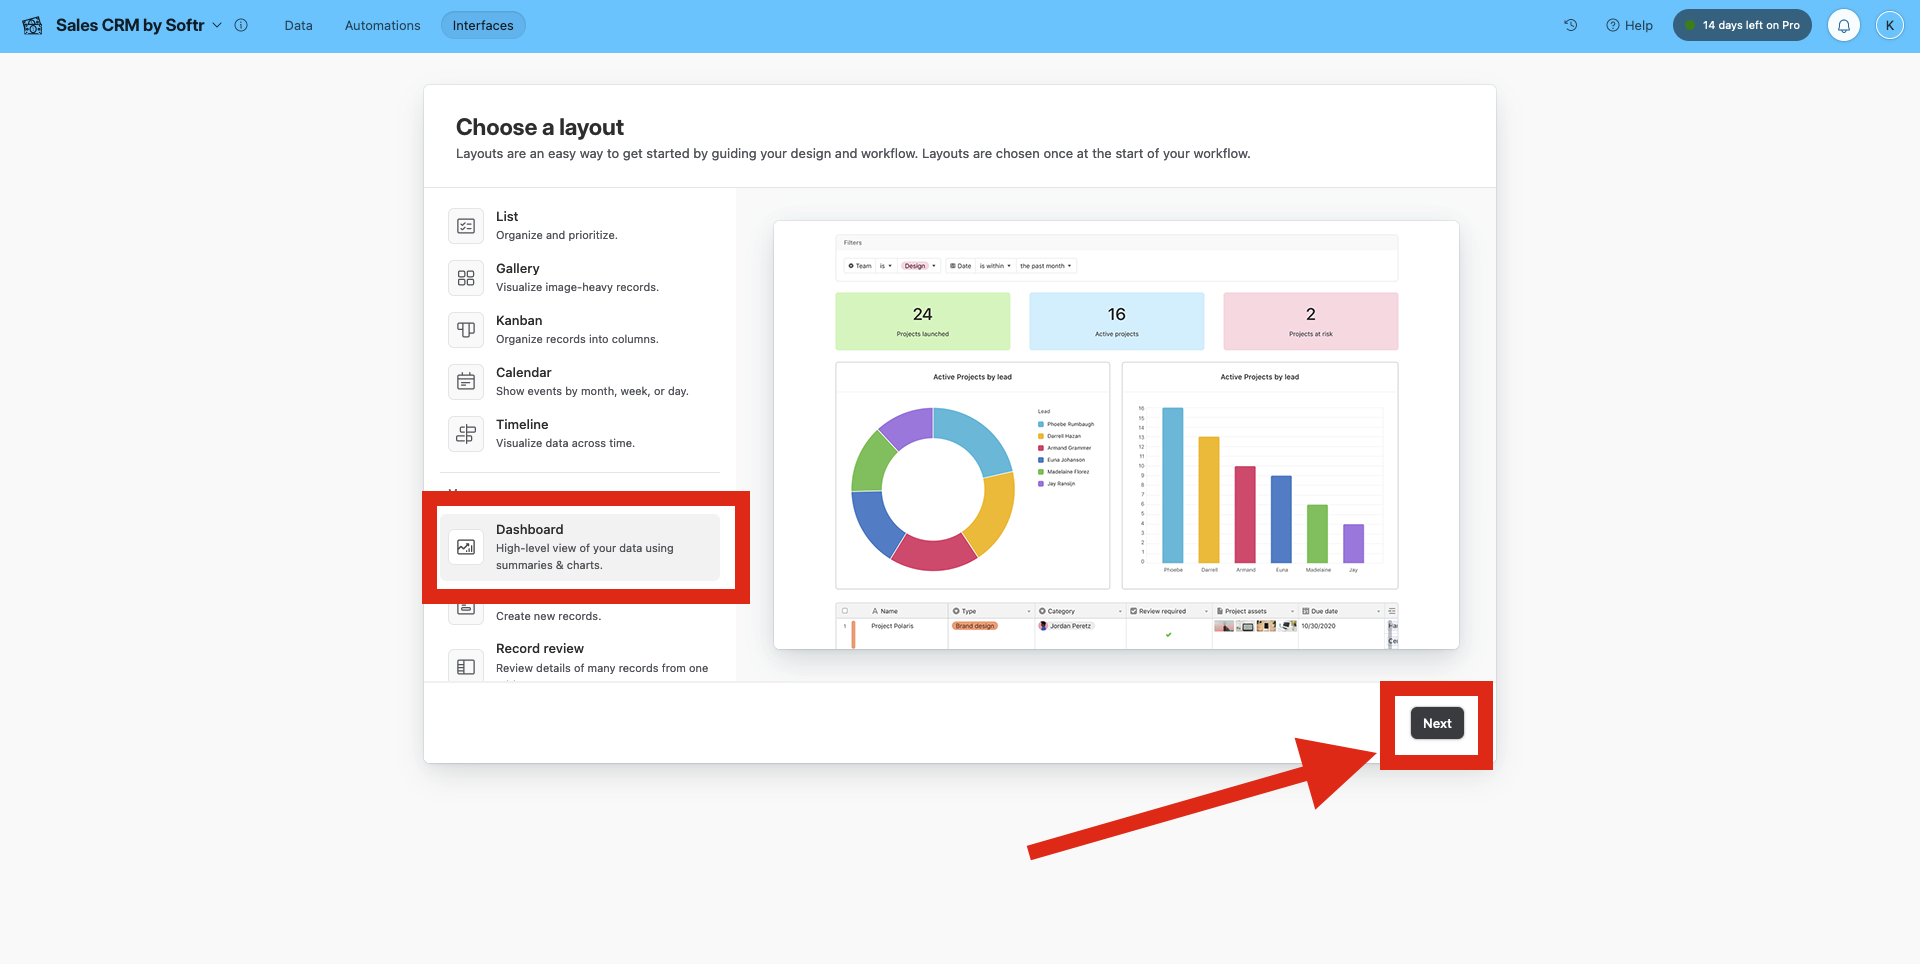
Step 3: Choose your interface layout
Airtable's page designer offers several layout templates so that you can showcase your current data in the most useful way.
Build an interface page in the app using any of these frameworks:
- Standard list;
- Gallery view;
- Kanban board;
... and more.For a summary report, you likely want to create an insights dashboard. For this example, let’s select “Dashboard” and click “Next”.
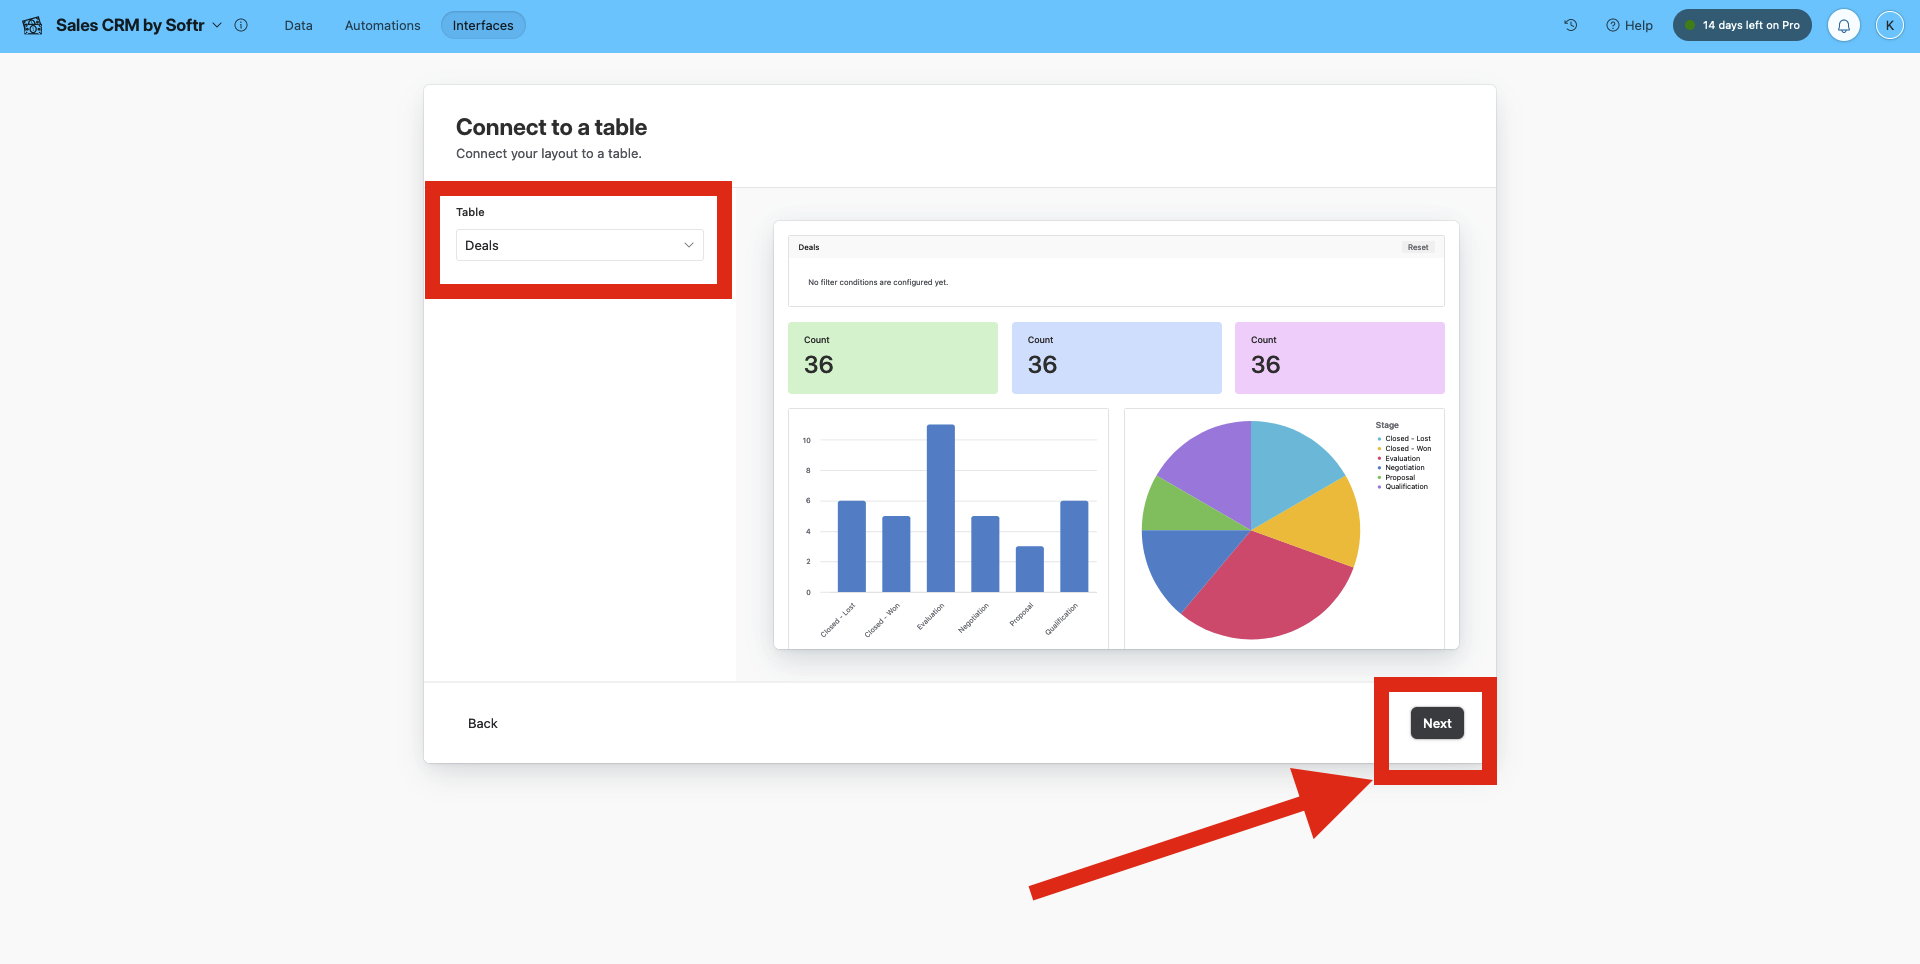
Step 4: Connect to a report table
Airtable has an easy to use data fetcher that pulls from any existing data.
Select a report table from your base as a data source for your report, then press “Next”.
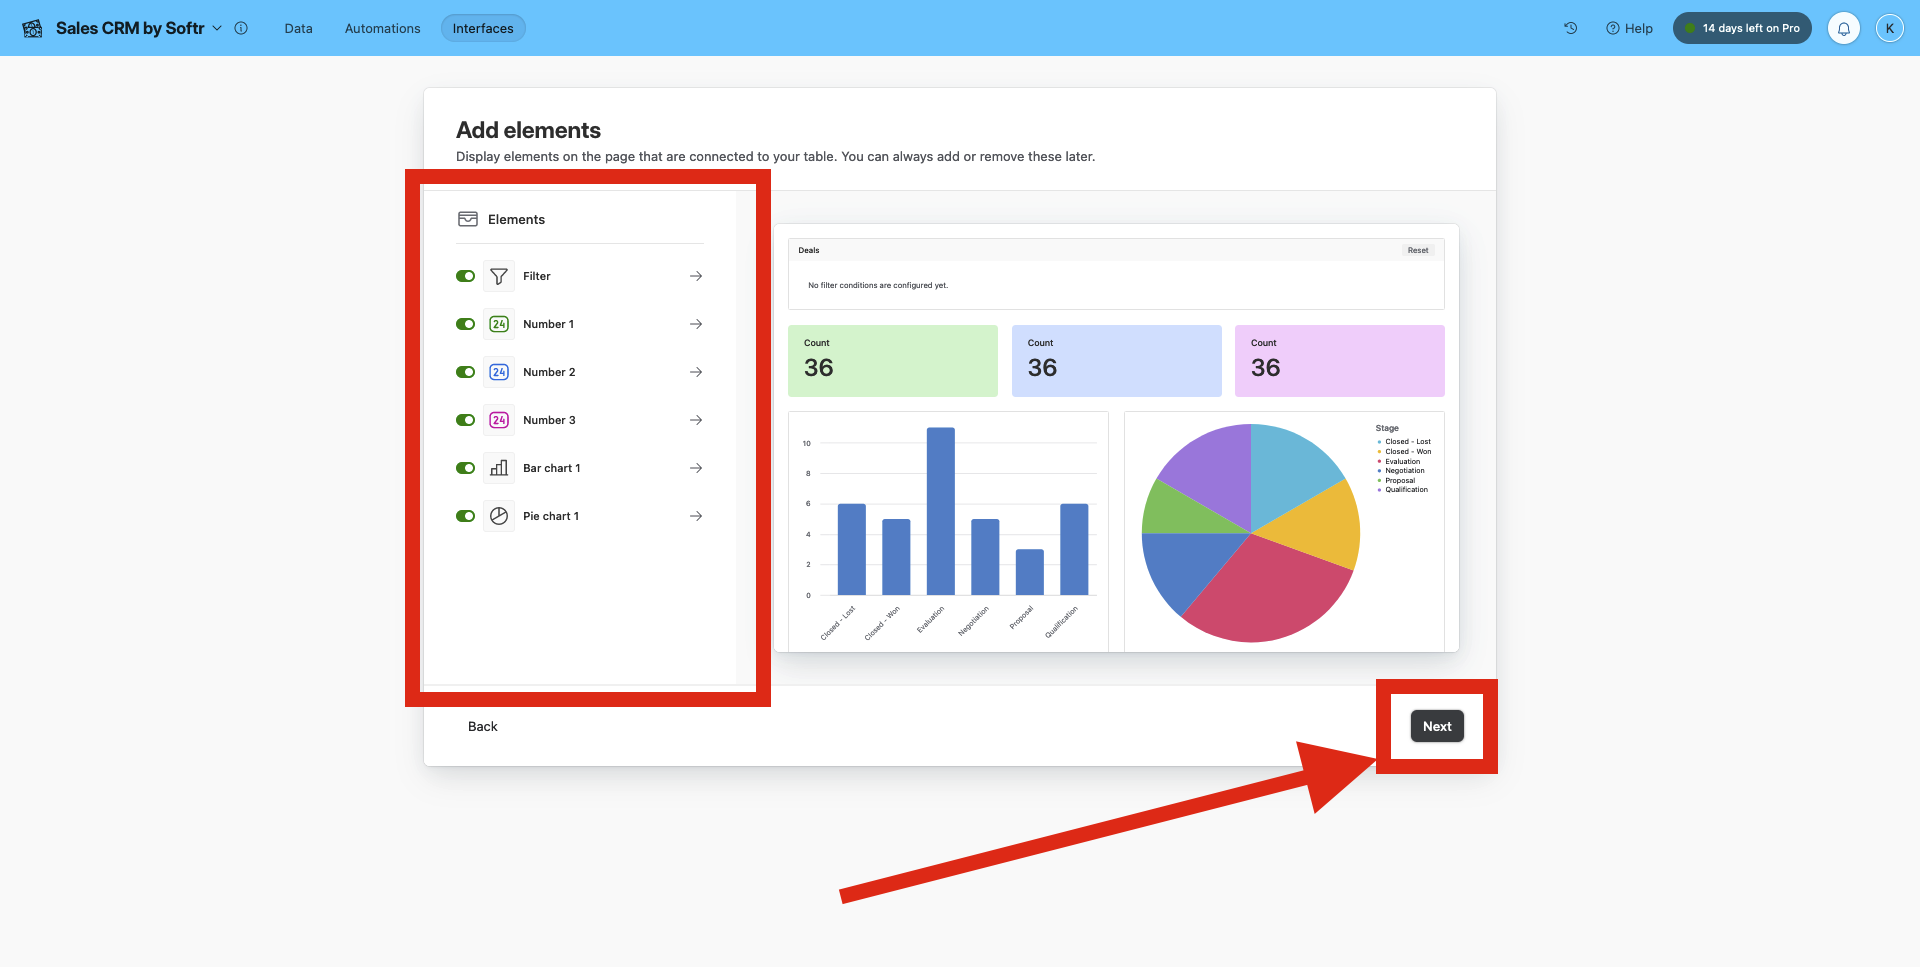
Step 5: Add elements to your report
Use the page designer to select elements from the list that you want to display. In this section, you can:
- Insert powerful charts (e.g., a pie chart, bar chart, and more);
- Add filters and conditions to the displayed data;
- Customize the color and font size;
Don't worry if you don't get everything exactly right here. With the page designer, you can create reports and then modify them later on.
Once you’re happy with this first version, click on “Next.”
Step 6: Name your report
Enter your report name in the “Name” field, and press “Finish” to complete the setup!

Step 7: Customize your Airtable Interface Designer report
You now have the first version of your report based on the setup steps we just completed.
Customization in the page designer is relatively easy, thanks to a drag-and-drop interface that doesn’t require technical skills.
To learn how to customize your interface, check out the following steps.
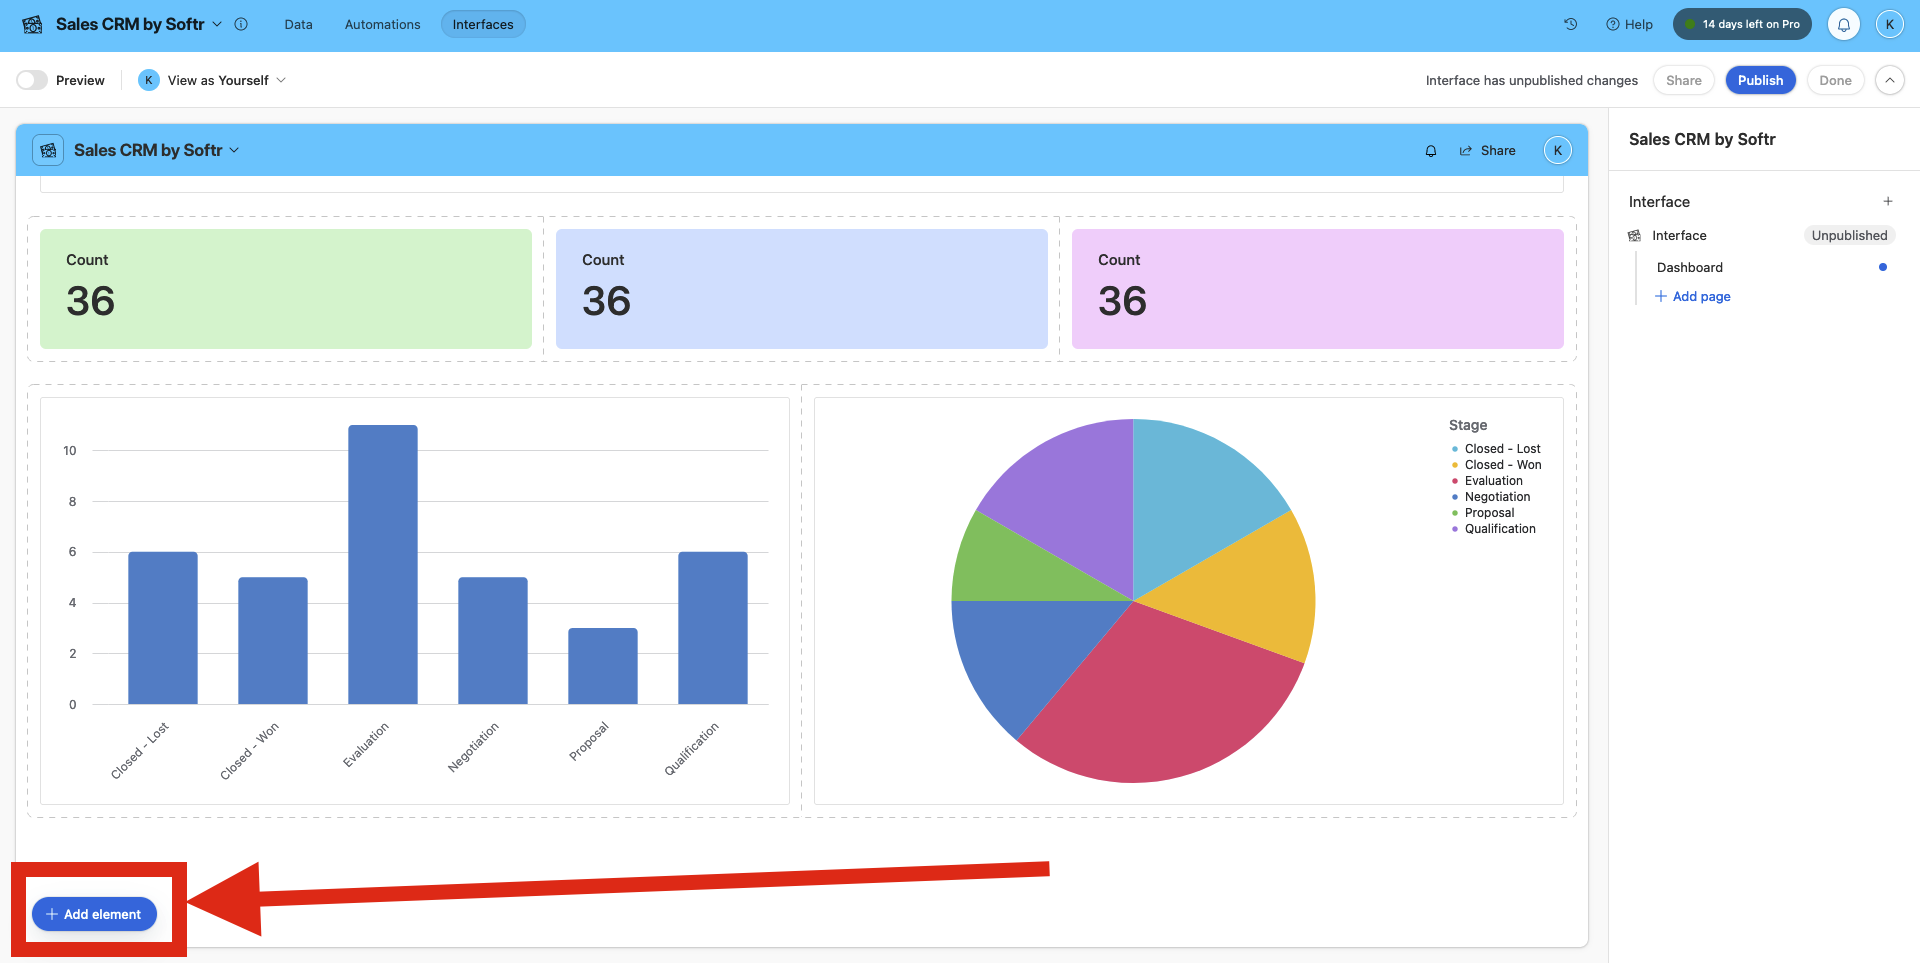
Step 7.1: Add new elements to your report
Add new elements to your report by clicking on the “+ Add element” button in the bottom-left corner of your interface.
From there, you’ll be able to customize the color and add various elements like:
- Text and font size;
- Dividers;
- Buttons;
- Numbers;
- Filters and conditions.
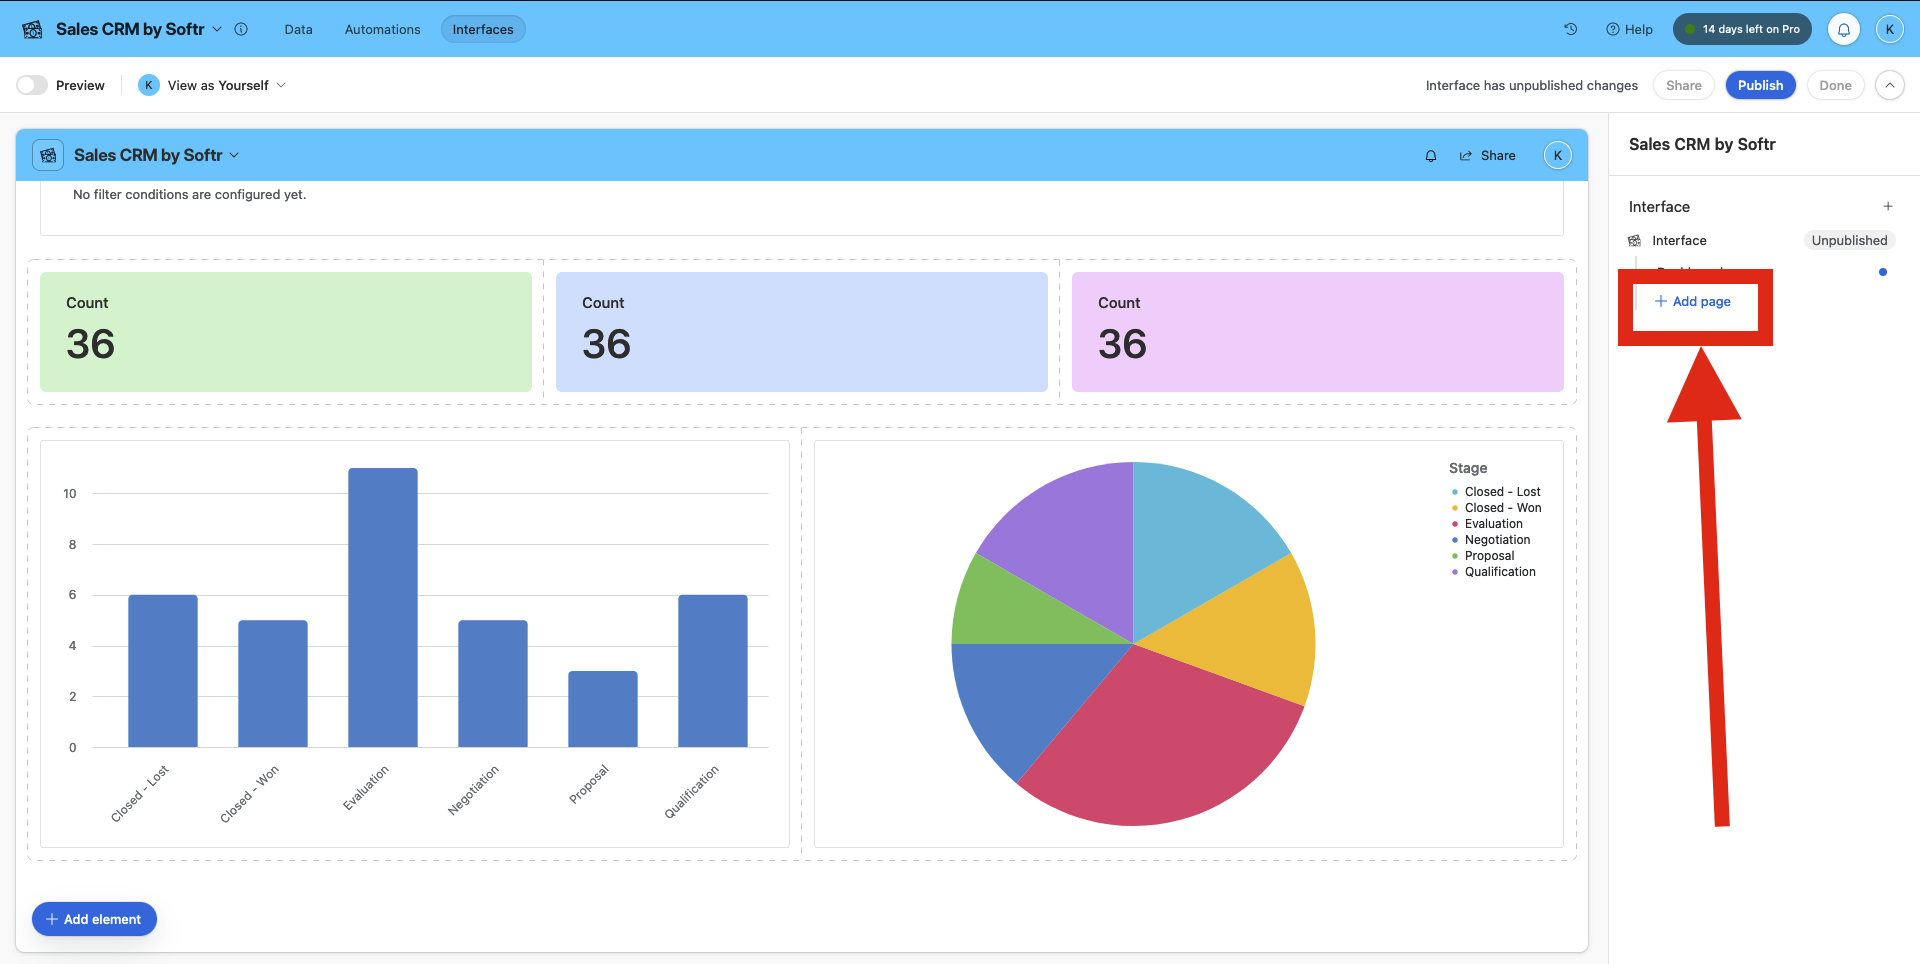
Step 7.2: Add a page to your interface
Click on “Add page” in the screen's right panel to add another page to your interface.
This will take you to the same setup process that you started with.
Step 7.3: Preview your report
Click the “Preview” button in the top-left corner to see what your published report will look like.
Note that when you share reports with a free Airtable account, you're also publishing the raw data.

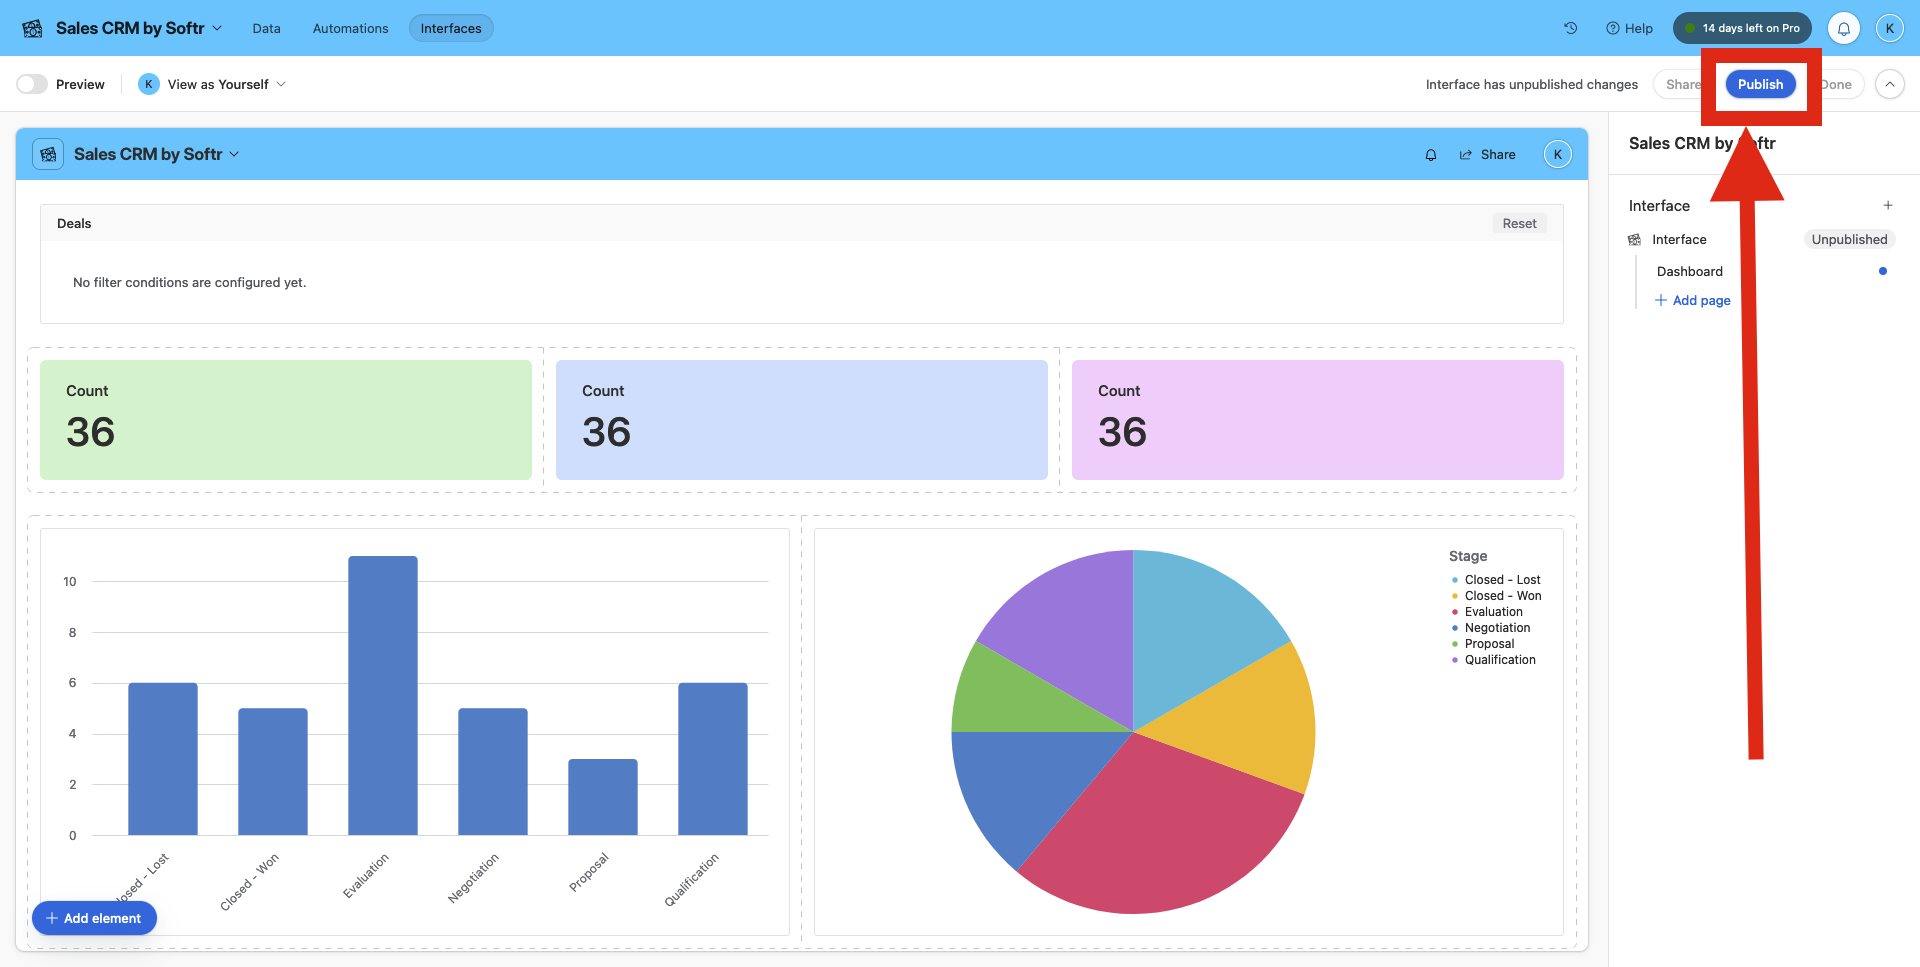
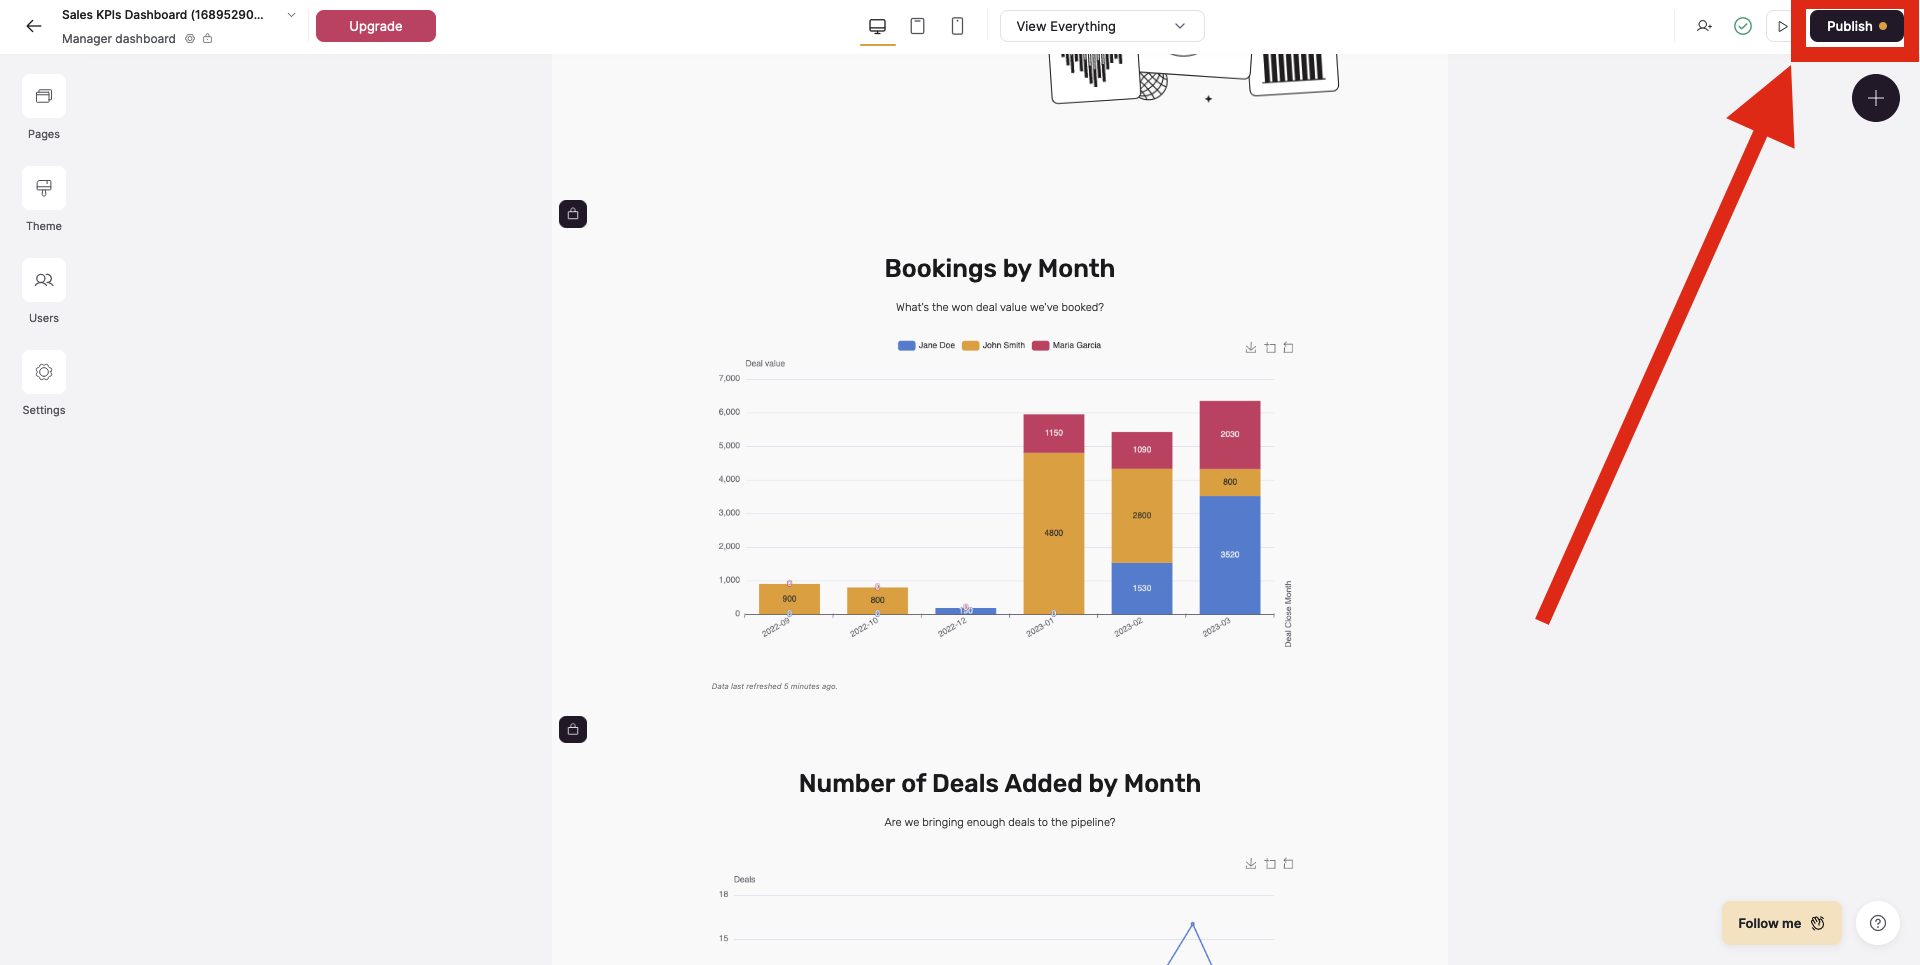
Step 8: Click on “Publish”
Once you’re happy with your report, hit the “Publish” button on the top-right corner!
If you want to send the interface to team members, you'll also have the option to "share report" via link or email.
One of the biggest concerns that users have with the Interface Designer as a report extension is that it has limited permissions and access levels.
If these security functions are a dealbreaker for you, we recommend building your report table in Softr.
Creating a report for your Airtable data using Softr
Softr expands on Airtable's core functionality so that you can create and customize report views for all internal and external stakeholders.
Unlike Airtable Interface Designer, Softr allows you to share your report publicly without putting your data at risk.
If you want to share your reports with specific people, then Softr allows your users to authenticate using any of the available options:
- Sign-in with SSO;
- SMS;
- Google Suite login (your Gmail or Google Docs account);
- A custom code.
Why use the Softr report extension
Softr is a no-code app builder and report extension that can create interfaces to visualize your Airtable data for any use case, like:
- Client portals;
- Internal project management tools;
- To use in presentations to internal or external stakeholders;
- and of course, reports.
The entire process will take you around 10 minutes and is entirely free using Softr’s free plan.
Softr also offers you templates, combined with design flexibility, so you don’t have to start your report from scratch.
How to create an Airtable report with Softr
Step 1: Log in to Softr
Create a free account or login to your Softr account using your credentials or Google.

Step 2: Click on “New application”
The first step is to create an application on Softr.
Click "New Application" to select a template.
For the sake of this example, let’s start with a template that will give us a great Airtable base to work on, and a corresponding application on Softr.

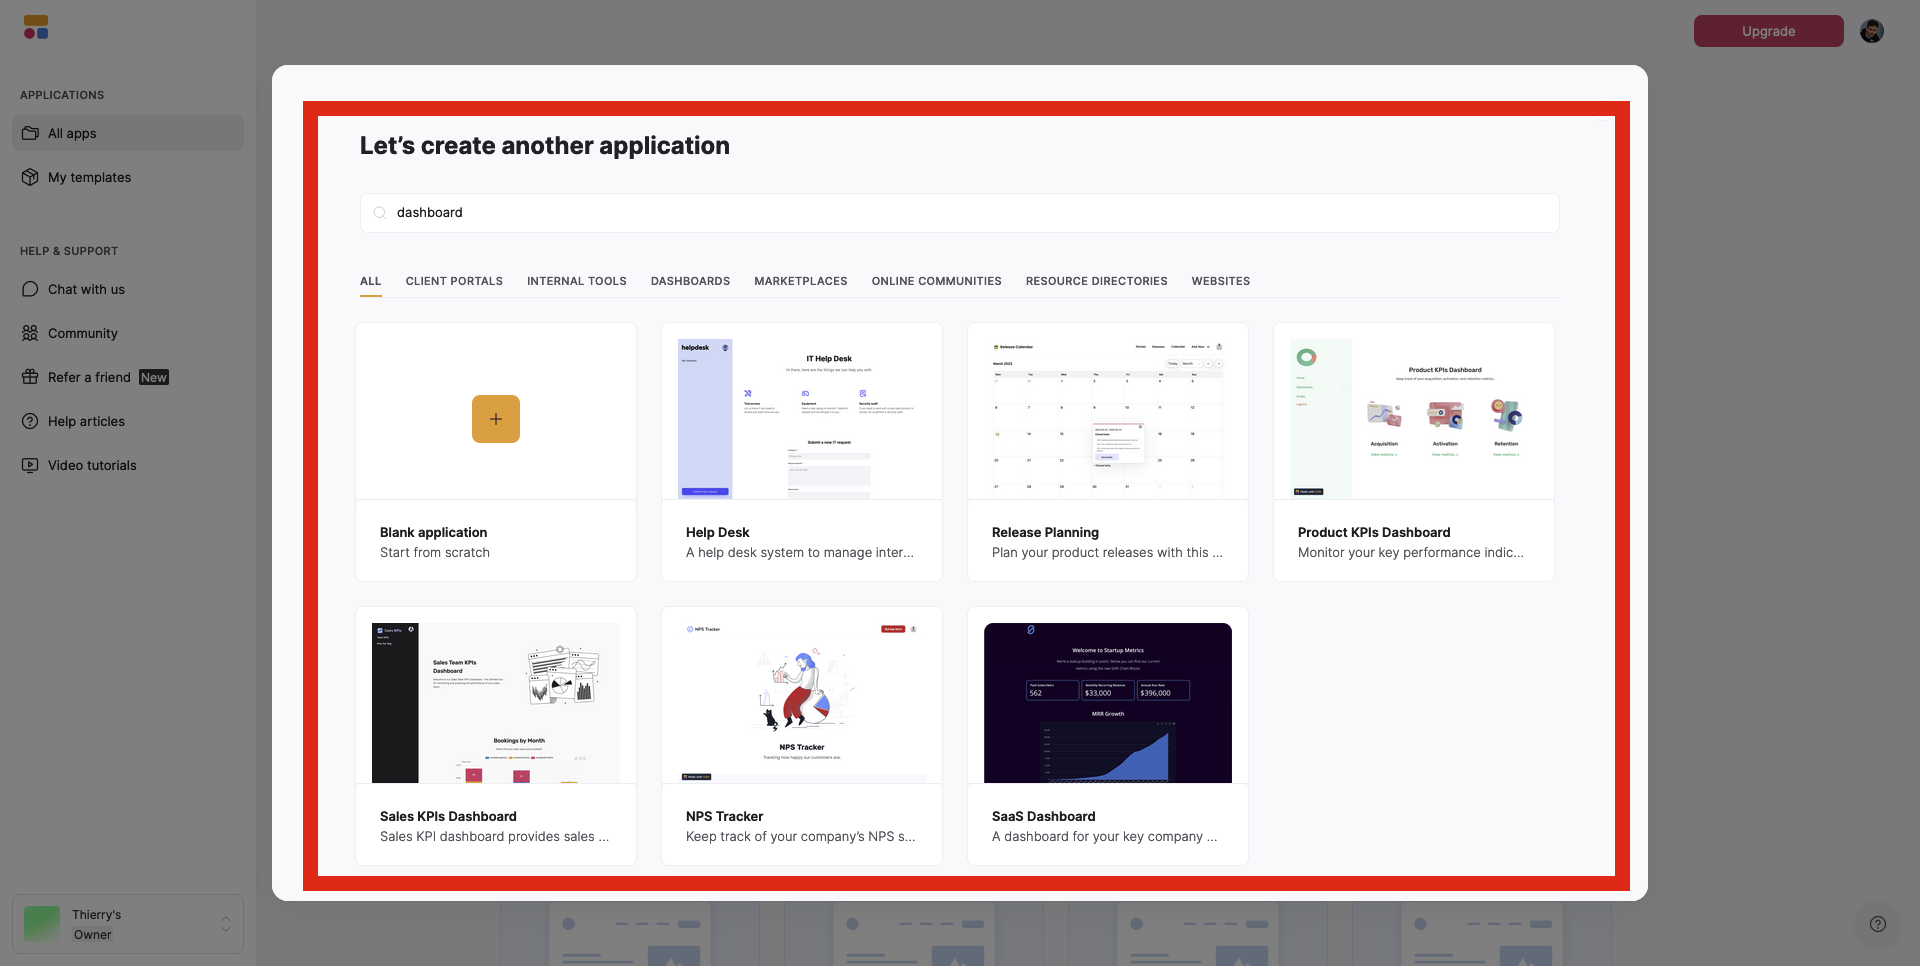
Step 3: Select a template
You can use the “search” field or browse the available templates.
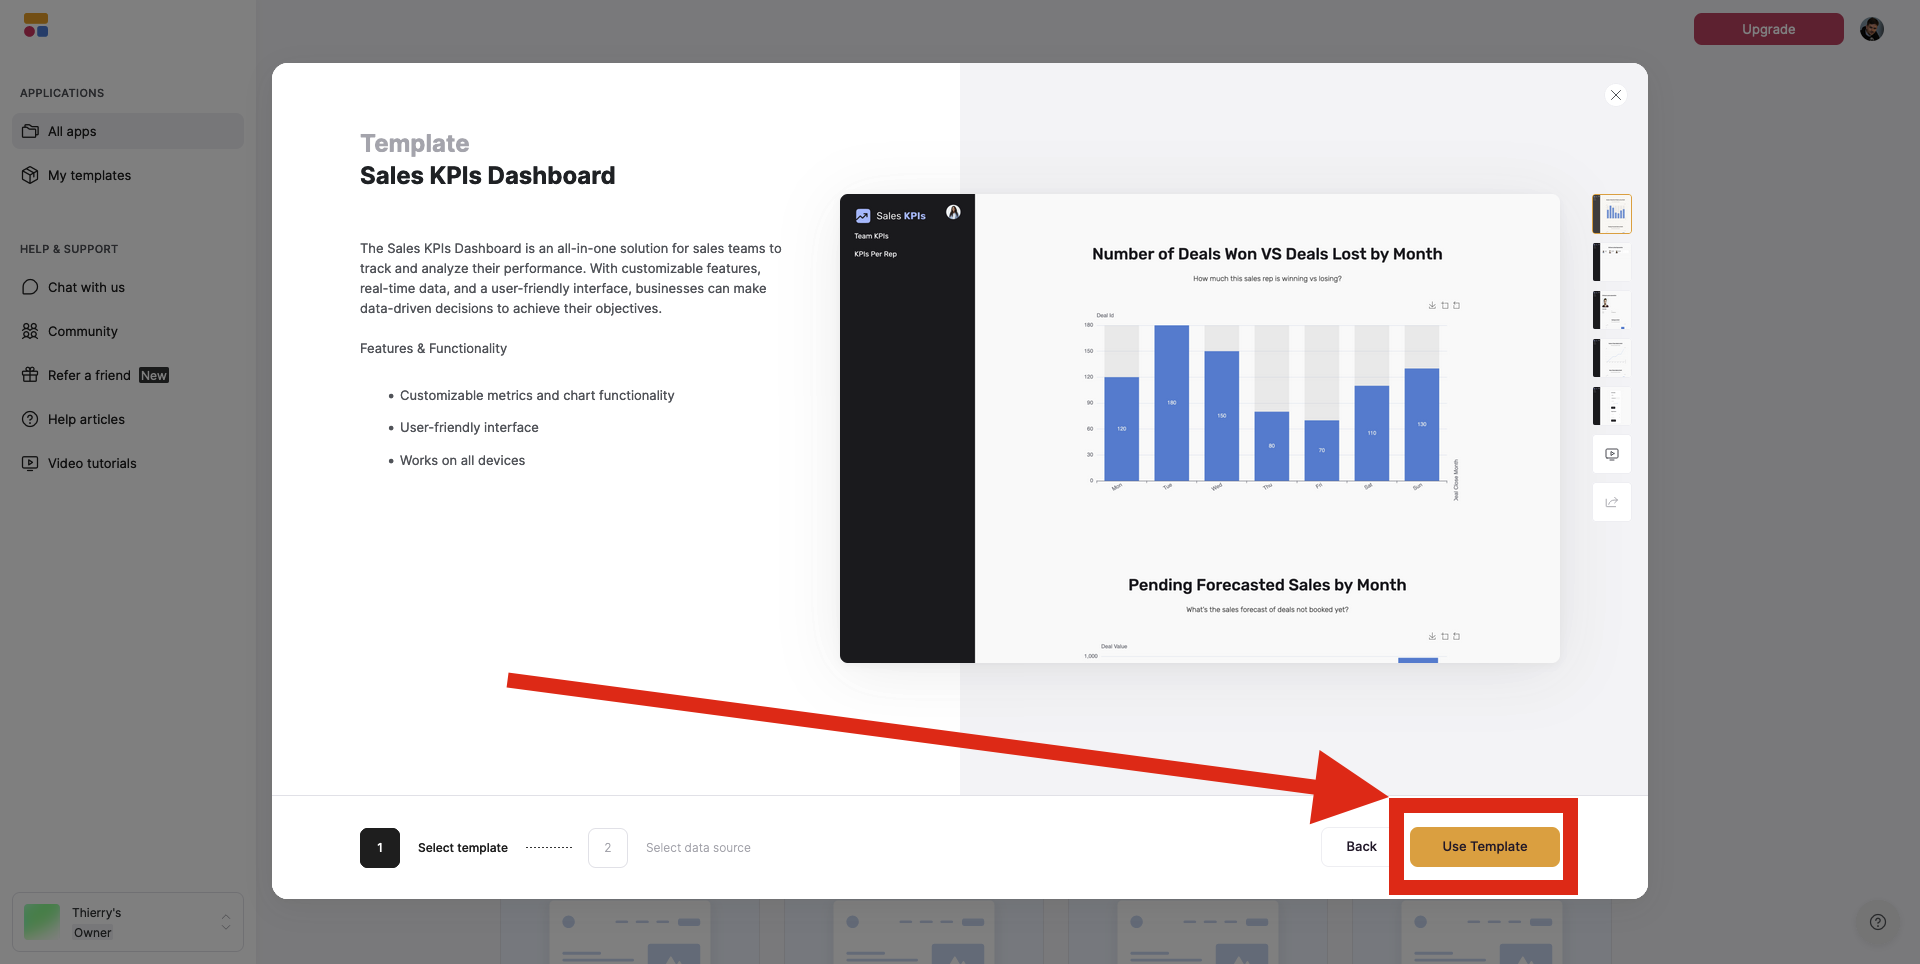
For this example, we chose to use the Sales KPIs Dashboard.
Step 4: Click on “Use Template”
Let’s get started with our template.
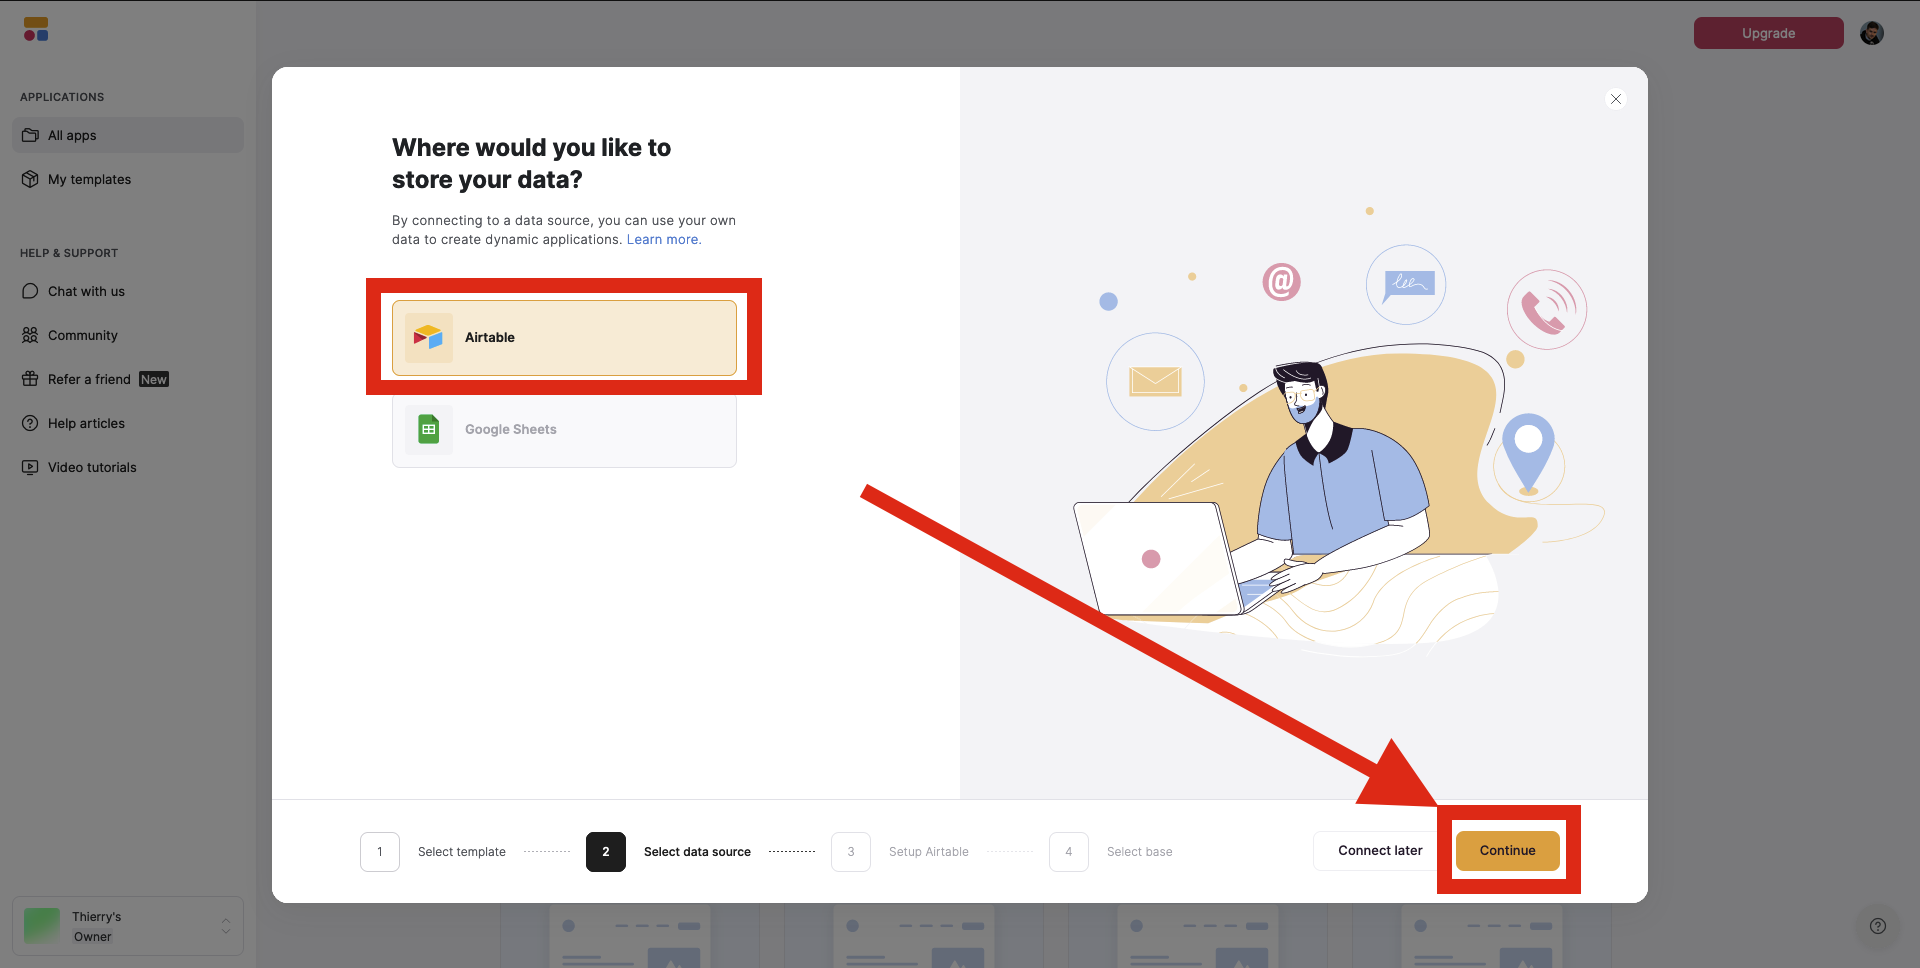
Step 5: Click on “Airtable” as your data source
To link the chart extension with your Airtable data, select Airtable as your data source.
Step 6: Choose your authentication method
You have the choice between using a personal access token or your API key.

Step 7: Click on “Copy base to your Airtable account”
Let's copy this base on our Airtable account.
This will redirect you to Airtable, where you can click “Add base” to complete the initial setup process.

Step 8: Your report is now synced with Airtable data
Changes in the Airtable data will be reflected in your new report.

Step 9: Customize your report
There are plenty of things you can do on Softr to further customize your new report.
Check out the following steps.
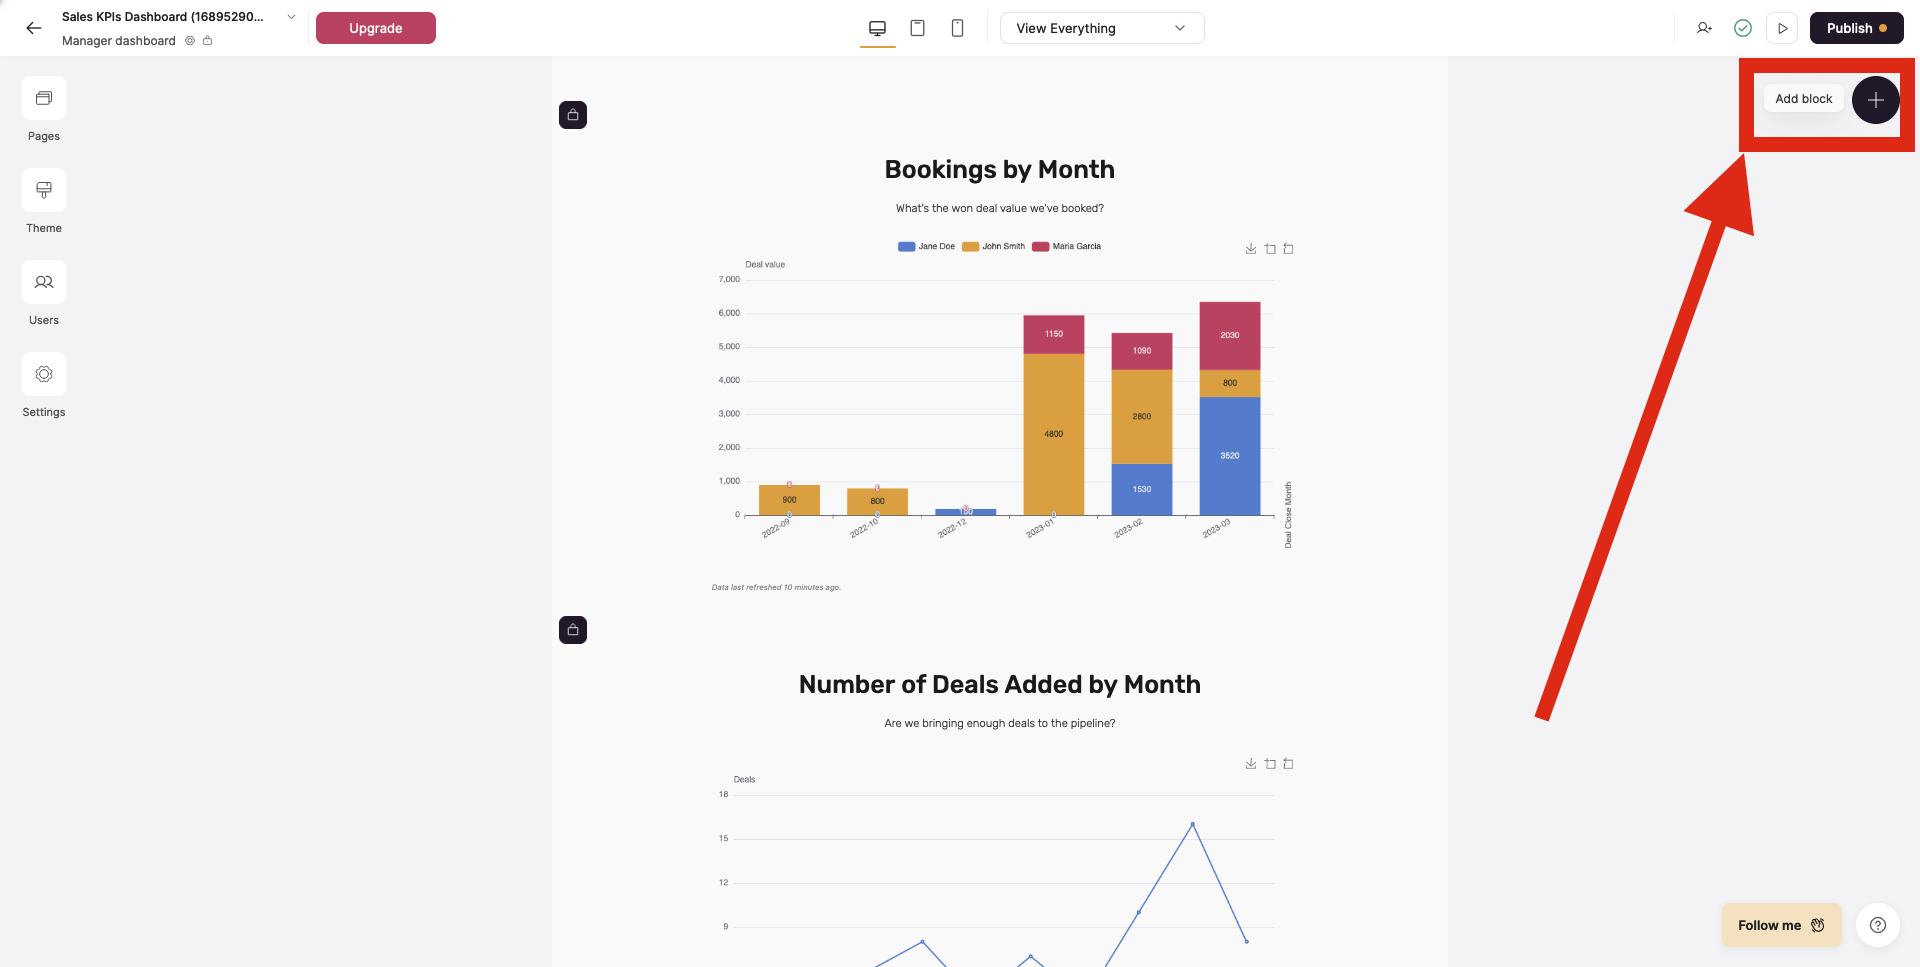
Step 9.1: Add new blocks to your report
Your report can be customized with entirely new blocks, either dynamic or statics, including:
- Forms;
- Lists;
- Tables;
- Charts;
- Kanban boards;
... and more
To do so, click on “Add block” and select which block you want to add.
Step 9.2: Set permissions for each block
This is one major way Softr's advanced access levels can help you.
By clicking on individual blocks and selecting the “visibility” tab, you are able to determine who should be able to see the content of that bloc.
This is particularly useful for sensitive information for example.
Step 9.3: When ready, click on “Publish” to set your report live
Whenever you’re ready to set your report live into the world, click on “Publish," set your customer domain and/or subdomain and hit “Publish” again.
Build powerful reports with advanced functionality
Custom Airtable reports are the best way to organize insights in a way that lets you spot trends, present to leadership, and streamline project management.
By combining Airtable's databases with Softr's report builder, you can capture a snapshot of all of your most important data, and easily customize your report for all audiences.
What is Softr
Softr is the easiest way to turn your data into powerful business apps—no code required. Connect to your spreadsheet or database, customize layout and logic, and share with your team or clients.
Join 700,000+ users worldwide, building client portals, internal tools, CRMs, dashboards, project management systems, inventory management apps, and more—all without code.
Join 700,000+ users worldwide, building client portals, internal tools, CRMs, dashboards, project management systems, inventory management apps, and more—all without code.
Get started free

Thierry Maout
Thierry is a content marketer based in France. He has extensive experience writing about B2B SaaS, automation, and user onboarding. Originally from France, he has lived and worked in Ireland, the US, Germany, the UK and Canada as well as collaborated with companies from all over the world including UserGuiding, Make (formerly Integromat), and others. Thierry has a Bachelor's degree in International Affairs from Le Havre University (France) as well as a Master's degree in Law, Economics, and Management from the Institute of Evolutionary Science of Montpellier (France). Passionate about education and the no-code movement, Thierry has been featured in publications such as UX Collective and The Startup on Medium. A frequent Softr collaborator (freelance-based), he’s also a former startup co-founder and has, among others, co-founded and managed growth at Fairwai.


Categories


