


"Wait, this doesn’t look right. I think we’ve got incomplete data here…" is the last thing you want to say at a client meeting.
Unfortunately, this happens too often. Agency reporting is frequently a stitched-together system software tools, spreadsheets, and screenshots. A 2023 Databox study found that just 21 percent of agencies reported via centralized dashboard, versus 51.5 percent by spreadsheet, presentation, or written document.
This is at best inefficient, at worst inaccurate.
Even if your agency is using software to solve these problems, most client reporting software excels only in certain areas like data consolidation or collaboration but falls short in others. Finding a solution that doesn't require compromise can be challenging -- but we've done the work for you.
Let's first explore the peculiarities of client reporting, and then dive into a list of seven reporting solutions that check the most boxes.
What is client reporting?
Client reporting is the process where a service provider (you) delivers detailed performance updates to their clients on a regular basis.
This type of reporting differs from internal performance analytics because it typically includes processed insights with informative visualizations, focusing on the end results rather than the underlying processes.
Why is client reporting important?
Providing timely reports keeps your clients informed about the work you do for them.
But client reporting offers much more than that.
When done right, it allows you to:
- Enhance transparency and trust between you and the client.
- Create a sense of control for your clients without the need for them to interfere with your processes.
- Involve clients in decision-making.
- Prove the need for strategic changes or budget increases.
- Demonstrate the value delivered to clients and extend your relationships.
Client reporting can help you make the most of your client relationships. Communication and transparency are massive for client satisfaction, the top factor for influencing client retention, according to a Agency Analytics survey.
Challenges with manual reporting
Forty-three percent of data and analytics leaders don’t have complete confidence in their data’s accuracy. According to the same report, insufficient data analysis tools are one of the top reasons behind the issue.
Trying to take control over their data, many teams turn to good old manual data collection and reporting. But it’s a temporary fix, not a solution. Here’s why:
- Manual reporting eats up a great deal of productive time for your team.
- Like any manual process, it’s prone to errors.
- There’s no room for scaling: the more data you have, the more time you spend on reporting.
- Sourcing, filtering, consolidating, and visualizing data requires the use of multiple systems, which not only increases the likelihood of mistakes but also adds to expenses.
You can prevent all these issues by adding proper automated reporting software to your tech stack. Let’s go through what you should be looking for.
What is client reporting software?
Client reporting software is a tool that automates the process of generating performance updates for your clients. It gathers, analyzes, and organizes data from your business applications into clear and interpretable reports.
Key features to look for in client reporting software
Every reporting software has its strengths and weaknesses. However, there are certain features you should never compromise on:
1. Automated data collection and report generation
The primary goal of reporting software is to automate the tedious tasks of data collection and report creation. Choose software that handles this process without requiring involvement from your end.
2. Customizable report templates
You should be able to easily adjust the appearance of your reports for various scenarios. Quality reporting software typically offers a range of templates that you can customize to fit your specific needs with minimal effort.
3. Integration with other systems
You may have been using the built-in reporting features of your business apps for some time, but these come with a major limitation—they don’t allow you to pull data from different systems. Doing this manually is a hassle—it takes a lot of time, and there's always the risk of missing something.
That's why it's best to use dedicated client reporting software that integrates with all your business apps.
4. Real-time data visualization and interactive dashboards
You shouldn’t be spending your time creating charts and dashboards in Excel or Google Sheets. Instead, find software that does it for you.
Modern business reporting software automatically visualizes data with interactive charts and graphs, instantly making your raw data more accessible and actionable. You should also be able to configure each chart, apply filters, and edit your dashboards by adding or removing charts as needed.
5. Collaboration features
It's crucial to keep your client reporting accessible to those involved. Check if your software supports multi-user access and features like notifications, notes, and integration with your communication tools (e.g., Slack or Microsoft Teams).
At the same time, you need to keep your client data secure, which is hard when too many people have uncontrolled access to it. To strike the balance, you need software that offers smooth collaboration capabilities and granular access control.
6. Security and compliance features
In addition to permission controls, look for reporting software with robust security features to protect client data and meet regulatory standards. Ideally, the platform should support data encryption and user authentication, and adhere to any industry-specific regulations.
Top 7 client reporting software tools
Based on these criteria, we've selected the top seven client reporting software and tools.
1. Softr

Softr rightfully takes the top spot as a highly customizable no-code tool for building client reporting dashboards of any complexity. Because we know out-of-the-box isn’t always an option.
Whether you need a simple interface to present visual performance insights to non-tech-savvy clients, or a sophisticated client portal with custom reporting and extra features, Softr is a go-to solution.
As a no-code app builder, Softr allows you to tailor your client reports to meet the specific needs of your organization and your clients. With it, you don’t have to settle for the limitations of ready-made software.
Softr offers a variety of building blocks, including Tables, Summary Cards, and Charts. These are ideal for building detailed performance reports—you can present your client data in any form you wish, from basic tables to line charts.
Softr ratings and reviews
- G2: 4.8/5 stars (382 reviews)
- Capterra: 4.7/5 stars (60 reviews)
Key features
- Drag-and-drop app builder
- Customizable client reports and visual dashboards
- Dozens of templates for internal and external portals and apps
- Granular permission and access level control
- Direct integrations with major data sources including Airtable, HubSpot, Google Sheets, Monday.com, MySQL, PostgreSQL, Xano, and others
- Integrations with analytics tools such as Google Analytics, Google Tag Manager, and Hotjar
Softr pros
- Allows you to embed performance reports right in the client portal (also built with Softr).
- Connects with a wide range of tools and databases.
- Suitable for developing an entire ecosystem of business apps seamlessly integrated with each other.
- Centralizes all your customer data in one place.
- Highly customizable to address the specific needs of your organization.
Softr limitations
- Although Softr offers pre-built templates for various kinds of dashboards, it requires your input to build a custom reporting solution.
- While Softr is user-friendly for basic setups, achieving advanced customizations may require a deeper understanding of the platform and more time to master.
Best for
Softr meets the needs of businesses of all sizes, from small and mid-sized companies to large organizations and enterprises across all industries.
Softr Pricing
- Free: $0 forever; 1 published app; 10 users
- Basic: $49/month; 3 published apps; 20 users
- Pro: $139/month; unlimited apps; 100 users
- Business: $269/month; unlimited apps; 2,500 users
- Enterprise: Custom plans and pricing
- See our Pricing page for full details
2. Looker Studio
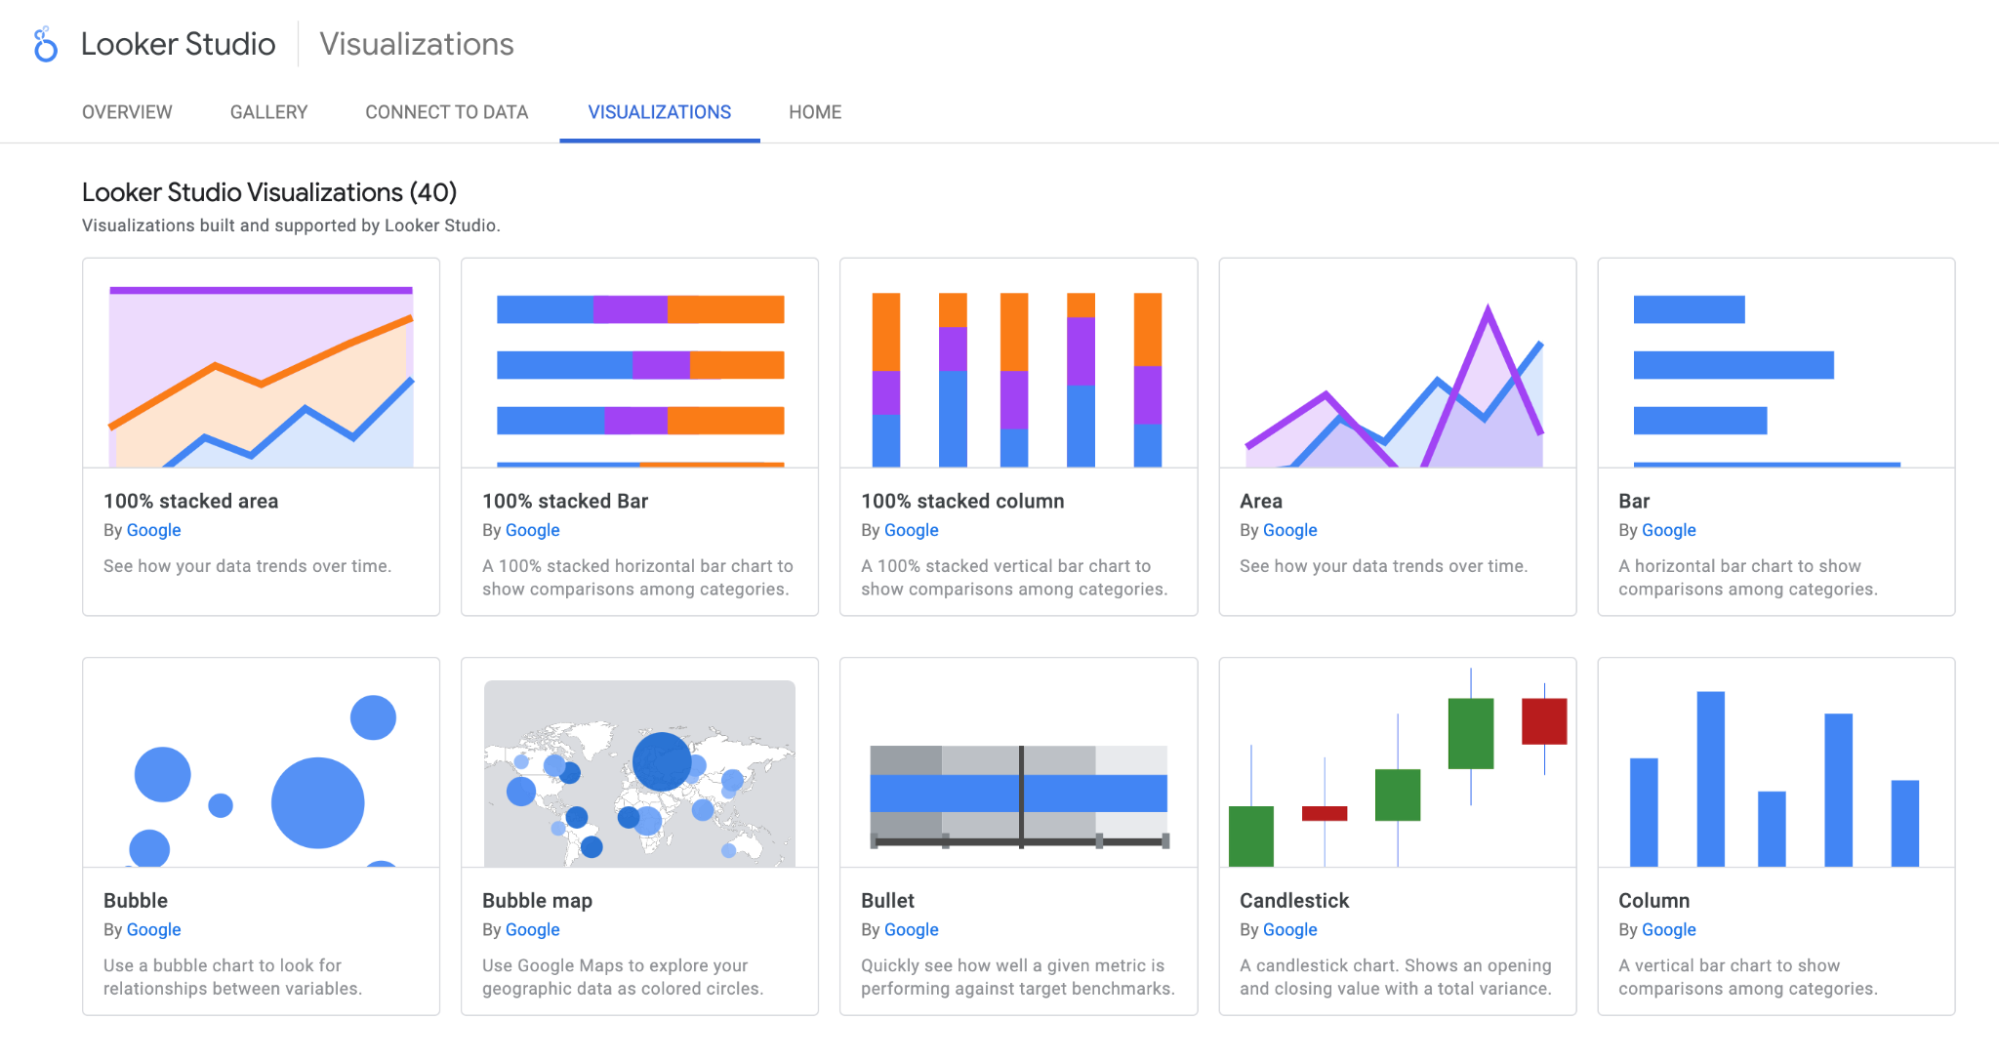
Looker Studio is a free data visualization platform designed by Google for small and mid-sized companies. With its familiar interface and seamless integration with other Google products, Looker Studio is one of the most user-friendly solutions for turning raw data into actionable insights.
The platform's biggest advantage is its cost—being free makes it especially attractive for solopreneurs and small agencies. Also, Looker Studio offers an impressive range of visualization options, from basic bar and pie charts to funnels and gauge visualizations. You can effortlessly visualize data from YouTube, Google Ads, Google Analytics 4, and other Google products, creating beautiful and detailed performance reports for your clients.
Key features
- Over 40 visualization types for your reports
- Extensive library of report templates
- Integrations with over 20 Google products
- Supports third-party connectors (paid) for more than 1,000 data sources
- Embeddable reports for any web page or intranet
Looker Studio pros
- Intuitive and user-friendly, even for non-technical users
- Wide range of customizable charts and graphs
- Free to use
Looker Studio limitations
- Integrating with non-Google apps via third-party connectors can be challenging and pricey
- Limited capabilities for reporting automation
- Collaboration features are only accessible in Looker Studio Pro
Best for
Small businesses operating across Google apps will appreciate Looker Studio’s free reporting functionality.
Pricing
The core version of Looker Studio is free. There’s also a Looker Studio Pro version available for Google Workspace or Cloud Identity Premium accounts. It includes advanced permission control, collaboration capabilities, and automated report delivery.
3. AgencyAnalytics

AgencyAnalytics is a well-known reporting software among small marketing agencies. It’s swift, simple, and robust—qualities that are often hard to find together in analytics software.
One of the main reasons teams opt for AgencyAnalytics is its quick and automated client reporting. The platform also offers built-in SEO tools, allowing you to monitor your SEO performance directly without needing additional third-party tools or connectors.
Key features
- Automated client reporting
- Built-in SEO tools
- Dozens of report templates
- Customizable dashboards
- Integrations with 80+ major platforms
- White-labeled reporting
- Mobile reporting app
AgencyAnalytics pros
- Quick setup.
- Easy to navigate, even for those without a technical background.
- An all-in-one reporting solution.
- White-label features for branding customization.
AgencyAnalytics limitations
- Higher cost compared to other options in the market.
- The app’s simplicity may not meet the complex needs of larger organizations.
Best for
It's suited for marketing agencies that want an all-in-one platform that will simplify client reporting and integrate well with major marketing tools.
Pricing
Pricing starts at $79/month for up to 5 client campaigns and 5 agency users. Additional campaigns in this tier cost $16/month each. The next pricing tier, which includes cross-campaign reporting, custom permissions, and white-labeling, is $179/month and covers up to 10 campaigns.
4. Zoho Analytics

Zoho Analytics is a self-service business intelligence (BI) platform that simplifies data visualization with its intuitive drag-and-drop interface. It offers a wide range of visualization options, including multi-tab themed dashboards, chart-type KPI widgets, and more.
What sets Zoho Analytics apart is its AI-powered analytics. The platform features a conversational AI assistant that enables you and your clients to easily extract insights from your data by simply asking questions.
Key features
- Drag-and-drop report builder
- Over 75 visualizations for custom reports
- AI-powered data insights and predictions
- Secure collaboration tools for teams and stakeholders
- Branded reporting
- Out-of-the-box integrations with over 500 tools
- Mobile BI app
Zoho Analytics pros
- AI-driven data interpretation makes data accessible to all users.
- Integrates seamlessly with Zoho’s comprehensive suite of tools.
- Offers robust collaboration features and secure sharing options.
Zoho Analytics limitations
- Steep initial learning curve.
- Extensive features can be overwhelming, especially if you don’t need all of them.
Best for
While Looker Studio is ideal for teams that rely heavily on Google products, Zoho Analytics is the go-to choice for organizations already using Zoho’s suite of tools (or are willing to implement it).
Pricing
Paid plans start at $24/month for up to 2 users and 0.5 million data rows. Additional users cost $6.40 per month, billed annually. Extra viewer credits are available in packs of 25 for $80/month, billed annually.
Higher pricing tiers, which include conversational AI and advanced access control, start at $48/month for up to 5 users.
5. Whatagraph

Whatagraph is a marketing reporting tool designed for in-house teams and marketing agencies.
Its standout feature is the simplicity it offers in consolidating data, creating custom metrics, and integrating data from various sources. You don’t need extensive experience to build a performance dashboard from scratch.
Key features
- Automated reporting
- Custom metrics and dashboards
- Intuitive visualization builder
- Dozens of instant report templates
- Native integrations with over 50 marketing data sources
- White-label reporting options
Whatagraph pros
- Simple and accessible user interface.
- Fully automates client reporting.
Whatagraph limitations
- No lower-tier plans available.
- Limited customization options for visualizing data, which may not meet the needs of larger organizations.
- Often lacks direct integrations with some tools in users' tech stacks.
Best for
In-house teams and small marketing agencies choose Whatagraph to simplify reporting. Its simplicity allows teams to make data more accessible and eliminate manual reporting, though it doesn’t offer much flexibility for larger organizations with more complex needs.
Pricing
Whatagraph starts at $259/month for up to 5 users. Custom branding, metrics, and data blending are available at $499/month.
6. Klipfolio

Klipfolio is a low-code reporting tool for businesses that need a robust analytics solution. While it does offer a user-friendly interface for all skill levels, you’ll need technical experience to enjoy its nearly limitless customization options.
The platform is known for its flexibility in connecting to a wide array of data sources, making it ideal for complex reporting needs.
Key features
- Customizable dashboards
- Embeddable data visualizations
- Over 100 pre-built data source connections
- Drag-and-drop editor for easy report creation
- Extensive library of templates and widgets
- White-labeling
Klipfolio pros
- Highly customizable dashboards and reports.
- Supports a wide range of data sources and integrations.
Klipfolio limitations
- Too advanced for beginners in BI.
- Building custom visualizations requires coding experience (or a developer).
Best for
Klipfolio is ideal for tech-savvy agency teams that need to integrate with multiple data sources and require advanced reporting capabilities.
Pricing
Agency packages start at $190/month for up to 20 clients and an hourly data refresh rate. You can purchase add-ons to increase the number of dashboards for $8/month and to refresh data more frequently for $139/month. More advanced plans are available at $420/month and $1,025/month.
7. Tableau

Tableau is BI software by Salesforce. If you're familiar with Salesforce's flexible and robust products, you'll understand that Tableau is more than just a data visualization platform—it's a robust data processing and analytics machine.
Key features
- Real-time data updates and live data connections
- Advanced analytics with calculated fields and predictive modeling
- Secure sharing and collaboration tools
- Native connectors for all major data sources
- AI-powered insights
- Tableau Mobile
Tableau pros
- The reports that Tableau produces are totally customizable to your business needs.
- Strong community support and many online resources.
- Scalable for small teams to large enterprises.
Tableau limitations
- Complex for novice users.
- Costs can add up quickly with user licenses and add-ons.
Best for
The platform is most popular among mid-market companies and enterprises.
While you don’t have to be a Salesforce user to use Tableau, familiarity with Salesforce products can be beneficial.
Pricing
Plans start at $15/user/month for viewer access. Basic report creator capabilities are available at $42/user/month. Full capabilities are unlocked at $75/user/month.
How to choose the right client reporting software for your business
We’ve tried to pick software solutions for different needs and business sizes. Now, it's up to you to make the final choice. If you're still undecided, answering these questions will help guide your decision:
- What’s the size of your business?
- How many clients do you have?
- Do you need basic or advanced customization options?
- What integrations do you need?
- How important is the ease of use to you?
- What’s your software budget?
For instance, if you're a small marketing agency handling paid ads and SEO, a straightforward reporting tool like Looker Studio or AgencyAnalytics would be ideal. These platforms offer essential features to minimize or even eliminate manual reporting.
On the other hand, if you’re a large financial consultancy with diverse data sources and complex reporting needs, software like Softr or Tableau will be a better choice. These tools allow you to build a custom client reporting solution suited to your specific needs.
Why choose Softr for client reporting
Softr’s adaptability makes it an excellent option for both small and medium-sized businesses as well as large enterprises. For smaller businesses, it provides a way to compile data and create professional reports quickly and effortlessly. For larger organizations, Softr’s flexibility and advanced features support complex reporting needs.
Unlike many reporting platforms, Softr offers both ease of use and advanced features. You can enjoy user-friendly functionality without sacrificing advanced customization capabilities.
Frequently Asked Questions
What is Softr?
Softr is the easiest way to build custom apps and portals without code. Just connect it to your preferred data source (including Google Sheets and Airtable), customize layout and logic, set custom permissions, and share it with your clients or internal team on any device.
Do I need to take care of hosting and domain setup?
No. You can use a Softr subdomain (e.g. yoursite.softr.app) to publish your client reporting app. Later on, you can connect your custom domain to Softr in all of our paid plans. We also take care of hosting your app for you!
Is there a free trial available?
Yes, there's a free trial available for all the paid plans, and there's also a "forever free" plan that gives you access to key features to build and iterate.
Is it better to buy client reporting software or build your own?
If you want a solution that gives you more control over your [use case], caters to your needs, and is customized for you, building a solution in-house is a good option. It doesn’t have to be resource-heavy since no-code website and web app builders like Softr can help you get started in minutes.
If you need an off-the-shelf solution, you need to be okay with fewer customizations and potentially higher costs. Buying an out-of-box solution may not give you the same experience as building an on-brand solution specific to your client needs.
How do I manage separate views for different users?
With Softr's advanced permissions, you can easily tailor access for different user groups, giving each client a different user group, for example. This allows you to control what information different types of users can access, and which actions they can take. Conditional filters also let you control visibility at the block level.
What is Softr
Softr is the easiest way to turn your data into powerful business apps—no code required. Connect to your spreadsheet or database, customize layout and logic, and share with your team or clients.
Join 700,000+ users worldwide, building client portals, internal tools, CRMs, dashboards, project management systems, inventory management apps, and more—all without code.
Join 700,000+ users worldwide, building client portals, internal tools, CRMs, dashboards, project management systems, inventory management apps, and more—all without code.
Get started free

Adelina Karpenkova


Categories


